.
Netherlands
Netherlands, See : Flags, Maps

Amsterdam : Images
Rotterdam : Images
Scheveningen : Images
Utrecht : ImagesMarathon , G. H. Betz
------
Neêrlands Roem , Galerij van Beroemde Nederlanders, by J. van Lennep (Dutch)
The Rise of the Dutch Kingdom, Hendrik Willem van Loon
Old Houses in Holland, Sydney R. Jones
Erasmus and the Age of Reformation, Johan Huizinga
A Wanderer in Holland, E. V. Lucas
De Nederlandsche Geslachtsnamen, Johan Winkler
De Nederlandsche Nationale Kleederdrachten, Th. Molkenboer (Dutch)
Rembrandt's Amsterdam , Frits Lugt
In de Amsterdamsche Jodenbuurt , Jan Feith
Langs Rotte, Maas en Schie. I., J.M. Droogendijk and J.S. Verburg
The First Governess of the Netherlands, Margaret of Austria, Eleanor E. Tremayne
De Lof der Zotheid, Desiderius Erasmus
--
Mythen en Legenden van Egypte, Lewis Spence and J. W. van Rooijen
Bolivia.--Een in wording zijnde Staat aan den Stillen Oceaan, Emile Barbier
Het moderne Egypte: Wat er te zien en te hooren valt tusschen Kaïro en Faschoda, A. B. de Guerville
Een feudale familie in Egypte , Émile Amélineau
Reisbrieven uit Afrika en Azië, Aletta Henriëtte Jacobs
De beklimming van den Fuji-yama, J. Philipson-Radersma
Door Centraal-Oceanië, P. de Myrica
Door Holland met pen en camera , Lud. Georges Hamön
Door Noorwegen, G. Bosch
Op het Balkan-schiereiland , Percy E. Henderson
De monumenten van den Girnar, D. Menant
Achter den Sluier in Perzië en Turksch Arabië, by M. E. Hume-Griffith , Percy E. Henderson
In Portugal, Gérard de Beauregard and Louis de Fouchier
----
Art
ENGLISH
The art of the Dutch Republic, 1585-1718, Mariët Westermann
The Standard Galleries - Holland, Esther Singleton
Rembrandt, With a Complete List of His Etchings Arthur Mayger Hind
Rembrandt: the painter at work, Ernst van de Wetering
Rembrandt and the female nude, Eric Jan Sluijter
Fashion and fancy: dress and meaning in Rembrandt's paintings, Marieke de Winkel
A study of Vermeer, Edward A. Snow
Vermeer's Wager: speculations on art history, theory, and art museums , Ivan Gaskell
Vermeer's camera: uncovering the truth behind the masterpieces, Issue 2002, Philip Steadman
Vermeer and His Milieu: A Web of Social History, John Michael Montias
Van Gogh , Shelley Swanson Sateren
Van Gogh and the colors of the night, Sjraar van Heugten, Joachim Pissarro, Chris Stolwijk
Vincent Van Gogh: The starry night, Richard Thomson
The Van Gogh Blues: The Creative Person's Path Through Depression, Eric Maise
Van Gogh's progress: Utopia, modernity, and late-nineteenth-century art
Greece
De Geschiedenis van het Grieksche Volk, E.M. Tappan
Woordenboek der Grieksche en Romeinsche oudheid, Dr. J. G. Schlimmer and Dr. Z. C. de Boer
Marathon , G. H. Betz
Netherlands (Europe)
Introduction ::Netherlands
The Dutch United Provinces declared their independence from Spain in 1581; during the 17th century, they became a leading seafaring and commercial power, with settlements and colonies around the world. After 18 years of French domination, the Netherlands regained its independence in 1813. In 1830, Belgium seceded and formed a separate kingdom. The Netherlands remained neutral in World War I but suffered German invasion and occupation in World War II. A modern, industrialized nation, the Netherlands is also a large exporter of agricultural products. The country was a founding member of NATO and the EEC (now the EU) and participated in the introduction of the euro in 1999. In 2010, the former Netherlands Antilles was dissolved and the three smallest islands -- Bonaire, Sint Eustatius, and Saba -- became special municipalities in the Netherlands administrative structure. The larger islands of Sint Maarten and Curacao joined the Netherlands and Aruba as constituent countries forming the Kingdom of the Netherlands.
In 2018, the Sint Eustatius island council (governing body) was dissolved and replaced by a government commissioner to restore the integrity of public administration. According to the Dutch Government, the intervention will be as "short as possible and as long as needed."
Geography ::Netherlands
Geography
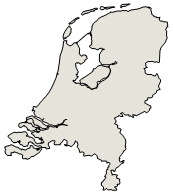
Location
Western Europe, bordering the North Sea, between Belgium and Germany
Geographic coordinates
52 31 N, 5 46 E

Map references
Europe
Area
total : 41,543 sq km
land: 33,893 sq km
water: 7,650 sq km
comparison ranking: total 134
Area - comparative
slightly less than twice the size of New Jersey
Area comparison map:

Land boundaries
total: 1,053 km
border countries (2): Belgium 478 km; Germany 575 km
Coastline
451 km
Maritime claims
territorial sea: 12 nm
contiguous zone: 24 nm
exclusive fishing zone: 200 nm
Climate
temperate; marine; cool summers and mild winters
Terrain
mostly coastal lowland and reclaimed land (polders); some hills in southeast
Elevation
highest point: Mount Scenery (on the island of Saba in the Caribbean, now considered an integral part of the Netherlands following the dissolution of the Netherlands Antilles) 862 m
lowest point: Zuidplaspolder -7 m
mean elevation: 30 m
note: the highest point on continental Netherlands is Vaalserberg at 322 m
Natural resources
natural gas, petroleum, peat, limestone, salt, sand and gravel, arable land
Land use
agricultural land: 55.1% (2018 est.)
arable land: 29.8% (2018 est.)
permanent crops: 1.1% (2018 est.)
permanent pasture: 24.2% (2018 est.)
forest: 10.8% (2018 est.)
other: 34.1% (2018 est.)
Irrigated land
2,969 sq km (2019)
Major rivers (by length in km)
Rijn (Rhine) river mouth (shared with Switzerland [s], Germany, and France) - 1,233 km
note – [s] after country name indicates river source; [m] after country name indicates river mouth
Major watersheds (area sq km)
Atlantic Ocean drainage: Rhine-Maas (198,735 sq km)
Population distribution
an area known as the Randstad, anchored by the cities of Amsterdam, Rotterdam, the Hague, and Utrecht, is the most densely populated region; the north tends to be less dense, though sizeable communities can be found throughout the entire country
Natural hazards
flooding
volcanism: Mount Scenery (887 m), located on the island of Saba in the Caribbean, last erupted in 1640; Round Hill (601 m), a dormant volcano also known as The Quill, is located on the island of St. Eustatius in the Caribbean; these islands are at the northern end of the volcanic island arc of the Lesser Antilles that extends south to Grenada
Geography - note
located at mouths of three major European rivers (Rhine (Rijn), Meuse (Maas), and Scheldt (Schelde)); about a quarter of the country lies below sea level and only about half of the land exceeds one meter above sea level
People and Society
Population
total: 17,772,378
male: 8,844,100
female: 8,928,278 (2024 est.)
comparison rankings: female 71; male 70; total 71
Nationality
noun: Dutchman(men), Dutchwoman(women)
adjective: Dutch
Ethnic groups
Dutch 75.4%, EU (excluding Dutch) 6.4%, Turkish 2.4%, Moroccan 2.4%, Surinamese 2.1%, Indonesian 2%, other 9.3% (2021 est.)
Languages
Dutch (official), Frisian (official in Fryslan province)
major-language sample(s): Het Wereld Feitenboek, een onmisbare bron van informatie. (Dutch)
The World Factbook, the indispensable source for basic information.
note: Frisian, Low Saxon, Limburgish, Romani, and Yiddish have protected status; Dutch is the official language of the three special municipalities of the Caribbean Netherlands; English is a recognized regional language on Sint Eustatius and Saba; Papiamento is a recognized regional language on Bonaire
Religions
Roman Catholic 20.1%, Protestant 14.8% (includes Dutch Reformed, Protestant Church of The Netherlands, Calvinist), Muslim 5%, other 5.9% (includes Hindu, Buddhist, Jewish), none 54.1% (2019 est.)
Age structure
0-14 years: 15.2% (male 1,384,142/female 1,312,455)
15-64 years: 64.1% (male 5,750,034/female 5,640,691)
65 years and over: 20.7% (2024 est.) (male 1,709,924/female 1,975,132)
2023 population pyramid:

Dependency ratios
total dependency ratio: 54.9
youth dependency ratio: 24
elderly dependency ratio: 30.9
potential support ratio: 3.2 (2021 est.)
Median age
total: 42.2 years (2024 est.)
male: 40.9 years
female: 43.5 years
comparison ranking: total 44
Population growth rate
0.39% (2024 est.)
comparison ranking: 160
Birth rate
10.6 births/1,000 population (2024 est.)
comparison ranking: 175
Death rate
9.7 deaths/1,000 population (2024 est.)
comparison ranking: 38
Net migration rate
3 migrant(s)/1,000 population (2024 est.)
comparison ranking: 37
Population distribution
an area known as the Randstad, anchored by the cities of Amsterdam, Rotterdam, the Hague, and Utrecht, is the most densely populated region; the north tends to be less dense, though sizeable communities can be found throughout the entire country
Urbanization
urban population: 93.2% of total population (2023)
rate of urbanization: 0.59% annual rate of change (2020-25 est.)
total population growth rate v. urban population growth rate, 2000-2030
Major urban areas - population
1.174 million AMSTERDAM (capital), 1.018 million Rotterdam (2023)
Sex ratio
at birth: 1.05 male(s)/female
0-14 years: 1.05 male(s)/female
15-64 years: 1.02 male(s)/female
65 years and over: 0.87 male(s)/female
total population: 0.99 male(s)/female (2024 est.)
Mother's mean age at first birth
30.2 years (2020 est.)
Maternal mortality ratio
4 deaths/100,000 live births (2020 est.)
comparison ranking: 174
Infant mortality rate
total: 3.6 deaths/1,000 live births (2024 est.)
male: 3.9 deaths/1,000 live births
female: 3.3 deaths/1,000 live births
comparison ranking: total 194
Life expectancy at birth
total population: 81.9 years (2024 est.)
male: 80.3 years
female: 83.5 years
comparison ranking: total population 39
Total fertility rate
1.61 children born/woman (2024 est.)
comparison ranking: 180
Gross reproduction rate
0.78 (2024 est.)
Contraceptive prevalence rate
73% (2013)
note: percent of women aged 18-45
Drinking water source
improved: urban: 100% of population
rural: 100% of population
total: 100% of population
unimproved: urban: 0% of population
rural: 0% of population
total: 0% of population (2020 est.)
Current health expenditure
11.1% of GDP (2020)
Physician density
4.08 physicians/1,000 population (2020)
Hospital bed density
3.2 beds/1,000 population (2018)
Sanitation facility access
improved: urban: 100% of population
rural: 100% of population
total: 100% of population
unimproved: urban: 0% of population
rural: 0% of population
total: 0% of population (2020 est.)
Obesity - adult prevalence rate
20.4% (2016)
comparison ranking: 99
Alcohol consumption per capita
total: 8.23 liters of pure alcohol (2019 est.)
beer: 3.95 liters of pure alcohol (2019 est.)
wine: 2.92 liters of pure alcohol (2019 est.)
spirits: 1.36 liters of pure alcohol (2019 est.)
other alcohols: 0 liters of pure alcohol (2019 est.)
comparison ranking: total 40
Tobacco use
total: 22.2% (2020 est.)
male: 24.4% (2020 est.)
female: 19.9% (2020 est.)
comparison ranking: total 70
Children under the age of 5 years underweight
NA
Currently married women (ages 15-49)
53.7% (2023 est.)
Education expenditures
5.3% of GDP (2020 est.)
comparison ranking: 64
Literacy
total population: NA
male: NA
female: NA
School life expectancy (primary to tertiary education)
total: 19 years
male: 18 years
female: 19 years (2020)

Environment
Environment - current issues
water and air pollution are significant environmental problems; pollution of the country's rivers from industrial and agricultural chemicals, including heavy metals, organic compounds, nitrates, and phosphates; air pollution from vehicles and refining activities
Environment - international agreements
party to: Air Pollution, Air Pollution-Heavy Metals, Air Pollution-Multi-effect Protocol, Air Pollution-Nitrogen Oxides, Air Pollution-Persistent Organic Pollutants, Air Pollution-Sulphur 85, Air Pollution-Sulphur 94, Air Pollution-Volatile Organic Compounds, Antarctic-Environmental Protection, Antarctic-Marine Living Resources, Antarctic Treaty, Biodiversity, Climate Change, Climate Change-Kyoto Protocol, Climate Change-Paris Agreement, Comprehensive Nuclear Test Ban, Desertification, Endangered Species, Environmental Modification, Hazardous Wastes, Law of the Sea, Marine Dumping-London Convention, Marine Dumping-London Protocol, Marine Life Conservation, Nuclear Test Ban, Ozone Layer Protection, Ship Pollution, Tropical Timber 2006, Wetlands, Whaling
signed, but not ratified: none of the selected agreements
Climate
temperate; marine; cool summers and mild winters
Land use
agricultural land: 55.1% (2018 est.)
arable land: 29.8% (2018 est.)
permanent crops: 1.1% (2018 est.)
permanent pasture: 24.2% (2018 est.)
forest: 10.8% (2018 est.)
other: 34.1% (2018 est.)
Urbanization
urban population: 93.2% of total population (2023)
rate of urbanization: 0.59% annual rate of change (2020-25 est.)
total population growth rate v. urban population growth rate, 2000-2030
Revenue from forest resources
0.01% of GDP (2018 est.)
comparison ranking: 156
Revenue from coal
0% of GDP (2018 est.)
comparison ranking: 160
Air pollutants
particulate matter emissions: 10.74 micrograms per cubic meter (2019 est.)
carbon dioxide emissions: 170.78 megatons (2016 est.)
methane emissions: 17.79 megatons (2020 est.)
Waste and recycling
municipal solid waste generated annually: 8.855 million tons (2015 est.)
municipal solid waste recycled annually: 2,179,216 tons (2015 est.)
percent of municipal solid waste recycled: 24.6% (2015 est.)
Major rivers (by length in km)
Rijn (Rhine) river mouth (shared with Switzerland [s], Germany, and France) - 1,233 km
note – [s] after country name indicates river source; [m] after country name indicates river mouth
Major watersheds (area sq km)
Atlantic Ocean drainage: Rhine-Maas (198,735 sq km)
Total water withdrawal
municipal: 2.05 billion cubic meters (2020 est.)
industrial: 5.94 billion cubic meters (2020 est.)
agricultural: 31 million cubic meters (2020 est.)
Total renewable water resources
91 billion cubic meters (2020 est.)
Geoparks
total global geoparks and regional networks: 2 (2024)
global geoparks and regional networks: De Hondsrug; Schelde Delta (includes Belgium) (2024)

Government
Country name
conventional long form: Kingdom of the Netherlands
conventional short form: Netherlands
local long form: Koninkrijk der Nederlanden
local short form: Nederland
abbreviation: NL
etymology: the country name literally means "the lowlands" and refers to the geographic features of the land being both flat and down river from higher areas (i.e., at the estuaries of the Scheldt, Meuse, and Rhine Rivers; only about half of the Netherlands is more than 1 meter above sea level)
Government type
parliamentary constitutional monarchy; part of the Kingdom of the Netherlands
Capital
name: Amsterdam; note - The Hague is the seat of government
geographic coordinates: 52 21 N, 4 55 E
time difference: UTC+1 (6 hours ahead of Washington, DC, during Standard Time)
daylight saving time: +1hr, begins last Sunday in March; ends last Sunday in October
time zone note: time descriptions apply to the continental Netherlands only, for the constituent countries in the Caribbean, the time difference is UTC-4
etymology: the original Dutch name, Amstellerdam, meaning "a dam on the Amstel River," dates to the 13th century; over time the name simplified to Amsterdam
Administrative divisions
12 provinces (provincies, singular - provincie), 3 public entities* (openbare lichamen, singular - openbaar lichaam (Dutch); entidatnan publiko, singular - entidat publiko (Papiamento)); Bonaire*, Drenthe, Flevoland, Fryslan (Friesland), Gelderland, Groningen, Limburg, Noord-Brabant (North Brabant), Noord-Holland (North Holland), Overijssel, Saba*, Sint Eustatius*, Utrecht, Zeeland (Zealand), Zuid-Holland (South Holland)
note 1: the Netherlands is one of four constituent countries of the Kingdom of the Netherlands; the other three, Aruba, Curacao, and Sint Maarten, are all islands in the Caribbean; while all four parts are considered equal partners, in practice, most of the Kingdom's affairs are administered by the Netherlands, which makes up about 98% of the Kingdom's total land area and population
note 2: although Bonaire, Saba, and Sint Eustatius are officially incorporated into the country of the Netherlands under the broad designation of "public entities," Dutch Government sources regularly apply to them the more descriptive term of "special municipalities"; Bonaire, Saba, and Sint Eustatius are collectively referred to as the Caribbean Netherlands
Independence
26 July 1581 (the northern provinces of the Low Countries formally declared their independence with an Act of Abjuration; however, it was not until 30 January 1648 and the Peace of Westphalia that Spain recognized this independence)
National holiday
King's Day (birthday of King WILLEM-ALEXANDER), 27 April (1967); note - King's or Queen's Day is observed on the ruling monarch's birthday; currently celebrated on 26 April if 27 April is a Sunday

Legal system
civil law system based on the French system; constitution does not permit judicial review of acts of the States General
Constitution
history: many previous to adoption of the "Basic Law of the Kingdom of the Netherlands" on 24 August 1815; revised 8 times, the latest in 1983
amendments: proposed as an Act of Parliament by or on behalf of the king or by the Second Chamber of the States General; the Second Chamber is dissolved after its first reading of the Act; passage requires a second reading by both the First Chamber and the newly elected Second Chamber, followed by at least two-thirds majority vote of both chambers, and ratification by the king; amended many times, last in 2023
International law organization participation
accepts compulsory ICJ jurisdiction with reservations; accepts ICCt jurisdiction
Citizenship
citizenship by birth: no
citizenship by descent only: at least one parent must be a citizen of the Netherlands
dual citizenship recognized: no
residency requirement for naturalization: 5 years
Suffrage
18 years of age; universal
Executive branch
chief of state: King WILLEM-ALEXANDER (since 30 April 2013)
head of government: Prime Minister Dick SCHOOF (since 2 July 2024)
cabinet: Council of Ministers appointed by the monarch
elections/appointments: the monarchy is hereditary; following Second Chamber elections, the leader of the majority party or majority coalition is usually appointed prime minister by the monarch; deputy prime ministers are appointed by the monarch
Legislative branch
legislature name: States General (Staten-Generaal)
legislative structure: bicameral
Legislative branch - lower chamber
chamber name: House of Representatives (Tweede Kamer der Staten-Generaal)
number of seats: 150 (all directly elected)
electoral system: proportional representation
scope of elections: full renewal
term in office: 4 years
most recent election date: 11/22/2023
parties elected and seats per party: Party for Freedom (PVV) (37); Labour Party (PvdA) (25); People's Party for Freedom and Democracy (VVD) (24); New Social Contract (NSC) (20); Democrats 66 (D66) (9); Other (35)
percentage of women in chamber: 38.7%
expected date of next election: November 2027
Legislative branch - upper chamber
chamber name: Senate (Eerste Kamer der Staten-Generaal)
number of seats: 75 (all indirectly elected)
scope of elections: full renewal
term in office: 4 years
most recent election date: 5/30/2023
percentage of women in chamber: 40%
expected date of next election: May 2027
Judicial branch
highest court(s): Supreme Court or Hoge Raad (consists of 41 judges: the president, 6 vice presidents, 31 justices or raadsheren, and 3 justices in exceptional service, referred to as buitengewone dienst); the court is divided into criminal, civil, tax, and ombuds chambers
judge selection and term of office: justices appointed by the monarch from a list provided by the House of Representatives of the States General; justices appointed for life or until mandatory retirement at age 70
subordinate courts: courts of appeal; district courts, each with up to 5 subdistrict courts; Netherlands Commercial Court
Political parties
Christian Democratic Appeal or CDA
Christian Union or CU
Correct Answer 2021 or JA21
Democrats 66 or D66
Denk
Farmer-Citizen Movement or BBB
50Plus
Forum for Democracy or FvD
Green Left (GroenLinks) or GL
Labor Party or PvdA
New Social Contract or NSC
Party for Freedom or PVV
Party for the Animals or PvdD
People's Party for Freedom and Democracy or VVD
Reformed Political Party or SGP
Socialist Party or SP
Together or BIJ1
Volt Netherlands or Volt
International organization participation
ADB (nonregional member), AfDB (nonregional member), Arctic Council (observer), Australia Group, Benelux, BIS, CBSS (observer), CD, CE, CERN, EAPC, EBRD, ECB, EIB, EITI (implementing country), EMU, ESA, EU, FAO, FATF, G-10, IADB, IAEA, IBRD, ICAO, ICC (national committees), ICCt, ICRM, IDA, IEA, IFAD, IFC, IFRCS, IGAD (partners), IHO, ILO, IMF, IMO, IMSO, Interpol, IOC, IOM, IPU, ISO, ITSO, ITU, ITUC (NGOs), MIGA, NATO, NEA, NSG, OAS (observer), OECD, OPCW, OSCE, Pacific Alliance (observer), Paris Club, PCA, Schengen Convention, SELEC (observer), UN, UNCTAD, UNESCO, UNHCR, UNHRC, UNIDO, UNMISS, UNOOSA, UNRWA, UN Security Council (temporary), UNTSO, UNWTO, UPU, Wassenaar Arrangement, WCO, WHO, WIPO, WMO, WTO, ZC
Diplomatic representation in the US
chief of mission: Ambassador Birgitta TAZELAAR (since 15 September 2023)
chancery: 4200 Linnean Avenue NW, Washington, DC 20008
telephone: [1] (202) 244-5300
FAX: [1] (202) 362-3430
email address and website:
was@minbuza.nl
https://www.netherlandsworldwide.nl/countries/united-states/about-us/embassy-in-washington-dc
consulate(s) general: Atlanta, Chicago, Miami, New York, San Francisco
Diplomatic representation from the US
chief of mission: Ambassador Shefali RAZDAN DUGGAL (since 19 October 2022)
embassy: John Adams Park 1, 2244 BZ Wassenaar
mailing address: 5780 Amsterdam Place, Washington DC 20521-5780
telephone: [31] (70) 310-2209
FAX: [31] (70) 310-2207
email address and website: AmsterdamUSC@state.gov
https://nl.usembassy.gov/
consulate(s) general: Amsterdam
Flag description
three equal horizontal bands of red (bright vermilion; top), white, and blue (cobalt); similar to the flag of Luxembourg, which uses a lighter blue and is longer; the colors were derived from those of WILLIAM I, Prince of Orange, who led the Dutch Revolt against Spanish sovereignty in the latter half of the 16th century; originally the upper band was orange, but because its dye tended to turn red over time, the red shade was eventually made the permanent color; the banner is perhaps the oldest tricolor in continuous use
National symbol(s)
lion, tulip; national color: orange
National anthem
name: "Het Wilhelmus" (The William)
lyrics/music: Philips VAN MARNIX van Sint Aldegonde (presumed)/unknown
note: adopted 1932, in use since the 17th century, making it the oldest national anthem in the world; also known as "Wilhelmus van Nassouwe" (William of Nassau), it is in the form of an acrostic, where the first letter of each stanza spells the name of the leader of the Dutch Revolt
National heritage
total World Heritage Sites: 13 (12 cultural, 1 natural); note - includes one site in Curacao
selected World Heritage Site locales: Schokland and Surroundings (c); Dutch Water Defense Lines (c); Van Nellefabriek (c); Mill Network at Kinderdijk-Elshout (c); Droogmakerij de Beemster (Beemster Polder) (c); Rietveld Schröderhuis (Rietveld Schröder House) (c); Wadden Sea (n); Seventeenth Century Canal Ring Area of Amsterdam inside the Singelgracht (c); Colonies of Benevolence (c); Frontiers of the Roman Empire - The Lower German Limes (c)

Economy
Economic overview
high-income, core EU- and eurozone-member economy; trade-oriented with strong services, logistics, and high tech sectors; exiting mild recession triggered by inflation and weak export demand; tight labor market; low deficits and manageable public debt; strong ratings for innovation, competitiveness, and business climate
Real GDP (purchasing power parity)
$1.277 trillion (2023 est.)
$1.276 trillion (2022 est.)
$1.215 trillion (2021 est.)
note: data in 2021 dollars
comparison ranking: 26
Real GDP growth rate
0.07% (2023 est.)
5.01% (2022 est.)
6.19% (2021 est.)
note: annual GDP % growth based on constant local currency
comparison ranking: 188
Real GDP per capita
$71,400 (2023 est.)
$72,100 (2022 est.)
$69,300 (2021 est.)
note: data in 2021 dollars
comparison ranking: 15
GDP (official exchange rate)
$1.154 trillion (2023 est.)
note: data in current dollars at official exchange rate
Inflation rate (consumer prices)
3.84% (2023 est.)
10% (2022 est.)
2.68% (2021 est.)
note: annual % change based on consumer prices
comparison ranking: 77
Credit ratings
Fitch rating: AAA (1994)
Moody's rating: Aaa (1986)
Standard & Poors rating: AAA (2015)
note: The year refers to the year in which the current credit rating was first obtained.
GDP - composition, by sector of origin
agriculture: 1.7% (2023 est.)
industry: 18.7% (2023 est.)
services: 69.6% (2023 est.)
note: figures may not total 100% due to non-allocated consumption not captured in sector-reported data
comparison rankings: services 41; industry 149; agriculture 169
GDP - composition, by end use
household consumption: 42.1% (2023 est.)
government consumption: 24.5% (2023 est.)
investment in fixed capital: 20.1% (2023 est.)
investment in inventories: -0.1% (2023 est.)
exports of goods and services: 88.5% (2023 est.)
imports of goods and services: -77.4% (2023 est.)
note: figures may not total 100% due to rounding or gaps in data collection
Agricultural products
milk, sugar beets, potatoes, pork, onions, wheat, chicken, tomatoes, carrots/turnips, goat milk (2022)
note: top ten agricultural products based on tonnage
Industries
agroindustries, metal and engineering products, electrical machinery and equipment, chemicals, petroleum, construction, microelectronics, fishing
Industrial production growth rate
-2.64% (2023 est.)
note: annual % change in industrial value added based on constant local currency
comparison ranking: 188
Labor force
10.017 million (2023 est.)
note: number of people ages 15 or older who are employed or seeking work
comparison ranking: 55
Unemployment rate
3.56% (2023 est.)
3.52% (2022 est.)
4.21% (2021 est.)
note: % of labor force seeking employment
comparison ranking: 63
Youth unemployment rate (ages 15-24)
total: 8.9% (2023 est.)
male: 9.4% (2023 est.)
female: 8.5% (2023 est.)
note: % of labor force ages 15-24 seeking employment
comparison ranking: total 144
Population below poverty line
14.5% (2021 est.)
note: % of population with income below national poverty line
Gini Index coefficient - distribution of family income
25.7 (2021 est.)
note: index (0-100) of income distribution; higher values represent greater inequality
comparison ranking: 150
Average household expenditures
on food: 11.8% of household expenditures (2022 est.)
on alcohol and tobacco: 3% of household expenditures (2022 est.)
Household income or consumption by percentage share
lowest 10%: 3.6% (2021 est.)
highest 10%: 21.4% (2021 est.)
note: % share of income accruing to lowest and highest 10% of population
Remittances
0.35% of GDP (2023 est.)
0.36% of GDP (2022 est.)
0.38% of GDP (2021 est.)
note: personal transfers and compensation between resident and non-resident individuals/households/entities
Budget
revenues: $399.616 billion (2022 est.)
expenditures: $398.696 billion (2022 est.)
note: central government revenues (excluding grants) and expenses converted to US dollars at average official exchange rate for year indicated
Public debt
56.5% of GDP (2017 est.)
note: data cover general government debt and include debt instruments issued (or owned) by government entities other than the treasury; the data include treasury debt held by foreign entities; the data include debt issued by subnational entities, as well as intragovernmental debt; intragovernmental debt consists of treasury borrowings from surpluses in the social funds, such as for retirement, medical care, and unemployment, debt instruments for the social funds are not sold at public auctions
comparison ranking: 87
Taxes and other revenues
23.26% (of GDP) (2022 est.)
note: central government tax revenue as a % of GDP
comparison ranking: 59
Current account balance
$113.676 billion (2023 est.)
$69.676 billion (2022 est.)
$105.942 billion (2021 est.)
note: balance of payments - net trade and primary/secondary income in current dollars
comparison ranking: 4
Exports
$1.022 trillion (2023 est.)
$1.007 trillion (2022 est.)
$910.795 billion (2021 est.)
note: balance of payments - exports of goods and services in current dollars
comparison ranking: 6
Exports - partners
Germany 19%, Belgium 14%, France 9%, UK 6%, Italy 5% (2022)
note: top five export partners based on percentage share of exports
Exports - commodities
refined petroleum, broadcasting equipment, machinery, packaged medicine, crude petroleum (2022)
note: top five export commodities based on value in dollars
Imports
$893.132 billion (2023 est.)
$915.294 billion (2022 est.)
$808.111 billion (2021 est.)
note: balance of payments - imports of goods and services in current dollars
comparison ranking: 7
Imports - partners
Germany 14%, China 12%, US 9%, Belgium 9%, UK 5% (2022)
note: top five import partners based on percentage share of imports
Imports - commodities
crude petroleum, refined petroleum, natural gas, broadcasting equipment, computers (2022)
note: top five import commodities based on value in dollars
Reserves of foreign exchange and gold
$69.83 billion (2023 est.)
$63.353 billion (2022 est.)
$64.469 billion (2021 est.)
note: holdings of gold (year-end prices)/foreign exchange/special drawing rights in current dollars
comparison ranking: 45
Exchange rates
euros (EUR) per US dollar -
Exchange rates:
0.925 (2023 est.)
0.95 (2022 est.)
0.845 (2021 est.)
0.876 (2020 est.)
0.893 (2019 est.)
Energy
Electricity access
electrification - total population: 100% (2022 est.)
Electricity
installed generating capacity: 57.194 million kW (2022 est.)
consumption: 111.757 billion kWh (2022 est.)
exports: 22.811 billion kWh (2022 est.)
imports: 18.544 billion kWh (2022 est.)
transmission/distribution losses: 4.817 billion kWh (2022 est.)
comparison rankings: transmission/distribution losses 165; imports 11; exports 11; consumption 32; installed generating capacity 27
Electricity generation sources
fossil fuels: 55.3% of total installed capacity (2022 est.)
nuclear: 3.3% of total installed capacity (2022 est.)
solar: 14.6% of total installed capacity (2022 est.)
wind: 17.6% of total installed capacity (2022 est.)
biomass and waste: 9.2% of total installed capacity (2022 est.)
Nuclear energy
Number of operational nuclear reactors: 1 (2023)
Net capacity of operational nuclear reactors: 0.48GW (2023 est.)
Percent of total electricity production: 3.4% (2023 est.)
Number of nuclear reactors permanently shut down: 1 (2023)
Coal
production: 1.825 million metric tons (2022 est.)
consumption: 10.61 million metric tons (2022 est.)
exports: 16.123 million metric tons (2022 est.)
imports: 24.908 million metric tons (2022 est.)
proven reserves: 3.247 billion metric tons (2022 est.)
Petroleum
total petroleum production: 70,000 bbl/day (2023 est.)
refined petroleum consumption: 872,000 bbl/day (2023 est.)
crude oil estimated reserves: 137.747 million barrels (2021 est.)
Natural gas
production: 17.774 billion cubic meters (2022 est.)
consumption: 33.243 billion cubic meters (2022 est.)
exports: 43.026 billion cubic meters (2022 est.)
imports: 65.807 billion cubic meters (2022 est.)
proven reserves: 132.608 billion cubic meters (2021 est.)
Carbon dioxide emissions
186.092 million metric tonnes of CO2 (2022 est.)
from coal and metallurgical coke: 20.014 million metric tonnes of CO2 (2022 est.)
from petroleum and other liquids: 110.348 million metric tonnes of CO2 (2022 est.)
from consumed natural gas: 55.73 million metric tonnes of CO2 (2022 est.)
comparison ranking: total emissions 31
Energy consumption per capita
186.89 million Btu/person (2022 est.)
comparison ranking: 20
Communications
Telephones - fixed lines
total subscriptions: 4.57 million (2022 est.)
subscriptions per 100 inhabitants: 26 (2022 est.)
comparison ranking: total subscriptions 31
Telephones - mobile cellular
total subscriptions: 20.737 million (2022 est.)
subscriptions per 100 inhabitants: 118 (2022 est.)
comparison ranking: total subscriptions 61
Telecommunication systems
general assessment: telecom infrastructure in the Netherlands continues to be upgraded as modernization schemes undertaken by telcos make steady progress; other fiber providers have been supported by regulatory measures which have encouraged municipal governments to intervene with telcos’ fiber builds, facilitating open access networks in a bid to make rollouts cheaper, and completed sooner; while the Mobile Network Operators (MNOs) are also closing down their Global System for Mobile Communication (MSM) and 3G networks and repurposing their spectrum and physical assets for LTE and 5G, the regulator has also encouraged GSM/3G roaming in the interim, thus safeguarding services such as machine to machine and other low data-use applications while individual MNOs disable their own GSM/3G networks; the country has one of the highest fixed broadband penetration rates in the world, with effective cross-platform competition between Digital Subscriber Line (DSL), Hybrid Fiber Coazial (HFC), and fiber networks; in the third quarter of 2020 the number of cable broadband connections fell for the first time, while the DSL segment has long been eclipsed by fiber; by the end of 2021, over a quarter of fixed broadband connections were on fiber infrastructure, while DSL accounted for only about 29%; almost 49% of fixed connections provided data above 100Mb/s, while an additional 43.7% provided data of at least 30Mb/s (2022)
domestic: fixed-line is 29 per 100 and mobile-cellular at 125 per 100 persons (2021)
international: country code - 31; landing points for Farland North, TAT-14, Circe North, Concerto, Ulysses 2, AC-1, UK-Netherlands 14, and COBRAcable submarine cables which provide links to the US and Europe; satellite earth stations - 5 (3 Intelsat - 1 Indian Ocean and 2 Atlantic Ocean, 1 Eutelsat, and 1 Inmarsat) (2019)
Broadcast media
more than 90% of households are connected to cable or satellite TV systems that provide a wide range of domestic and foreign channels; public service broadcast system includes multiple broadcasters, 3 with a national reach and the remainder operating in regional and local markets; 2 major nationwide commercial television companies, each with 3 or more stations, and many commercial TV stations in regional and local markets; nearly 600 radio stations with a mix of public and private stations providing national or regional coverage
Internet country code
.nl
Internet users
percent of population: 92% (2021 est.)
Broadband - fixed subscriptions
total: 7,525,016 (2020 est.)
subscriptions per 100 inhabitants: 44 (2020 est.)
comparison ranking: total 29
Transportation
National air transport system
number of registered air carriers: 8 (2020)
inventory of registered aircraft operated by air carriers: 238
annual passenger traffic on registered air carriers: 43,996,044 (2018)
annual freight traffic on registered air carriers: 5,886,510,000 (2018) mt-km
Civil aircraft registration country code prefix
PH
Airports
45 (2024)
note: Includes 3 airports in Bonaire, Sint Eustatius and Saba
comparison ranking: 93
Heliports
184 (2024)
Pipelines
14,000 km gas, 2,500 km oil and refined products, 3,000 km chemicals (2017)
Railways
total: 3,055 km (2020) 2,310 km electrified
comparison ranking: total 58
Roadways
total: 139,027 km (2022)
comparison ranking: total 39
Waterways
6,237 km (2012) (navigable by ships up to 50 tons)
comparison ranking: 23
Merchant marine
total: 1,187 (2023)
by type: bulk carrier 11, container ship 36, general cargo 521, oil tanker 27, other 592
comparison ranking: total 21
Ports
total ports: 18 (2024)
large: 2
medium: 4
small: 5
very small: 7
ports with oil terminals: 12
key ports: Amsterdam, Dordrecht, Europoort, Rotterdam, Terneuzen, Vlissingen
Military and Security
Military and security forces
Netherlands (Dutch) Armed Forces (Nederlandse Krijgsmacht): Royal Netherlands Army, Royal Netherlands Navy (includes Marine Corps), Royal Netherlands Air Force, Royal Netherlands Marechaussee (Military Constabulary) (2024)
note 1: the Netherlands Coast Guard and the Dutch Caribbean Coast Guard are civilian in nature but managed by the Royal Netherlands Navy
note 2: the core missions of the Royal Netherlands Marechaussee are border security, security and surveillance, and international and military police tasks; it has 21 brigades based in eight Dutch provinces, plus Curaçao in the Caribbean, a special missions security brigade, and separate security platoons to guard and protect domestic sites that are most likely to be the targets of attacks, such as government buildings
note 3: the national police maintain internal security in the Netherlands and report to the Ministry of Justice and Security, which oversees law enforcement organizations, as do the justice ministries in Aruba, Curacao, and Sint Maarten
Military expenditures
2.1% of GDP (2024 est.)
1.6% of GDP (2023)
1.5% of GDP (2022)
1.4% of GDP (2021)
1.4% of GDP (2020)
comparison ranking: 64
Military and security service personnel strengths
approximately 45,000 active-duty personnel (19,000 Army; 8,000 Navy; 8,000 Air Force; 6,000 Constabulary; 4,000 other) (2024)
note: the total figures include about 6,000 reservists on active duty; the Navy figures include about 2,300 marines
Military equipment inventories and acquisitions
the military's inventory consists of a mix of domestically produced and modern European- and US-sourced equipment; in recent years, the US has been the leading supplier of weapons systems; the Netherlands has an advanced domestic defense industry that focuses on armored vehicles, naval ships, and air defense systems; it also participates with the US and other European countries on joint development and production of advanced weapons systems (2024)
Military service age and obligation
17 years of age for voluntary service for men and women; the military is an all-volunteer force; conscription remains in place, but the requirement to show up for compulsory military service was suspended in 1997; must be a citizen of the Netherlands (2024)
note: in 2023, women made up about 14% of the military's full-time personnel
Military deployments
350 Lithuania (NATO); 200 Romania (NATO) (2024)
note: as of 2024, the Dutch military had close to 1,000 total military personnel deployed abroad
Military - note
the Dutch military is charged with the three core tasks of defending the country’s national territory and that of its allies, enforcing the national and international rule of law, and providing assistance during disasters and other crises; it also has some domestic security duties, including in the Dutch Caribbean territories; the military operates globally but rarely carries out military operations independently and focuses on cooperating with the armed forces of other countries, particularly with Belgium, Denmark, Germany, and the UK
the Netherlands has been a member of NATO since its founding in 1949, and the Dutch military is heavily involved in NATO missions and operations with air, ground, and naval forces, including air policing missions over the Benelux countries and Eastern Europe, NATO’s Enhanced Forward Presence initiative in the Baltic States and Eastern Europe, and several NATO naval flotillas, as well as standby units for NATO’s rapid response force; the military has previously deployed forces to NATO-led operations in Afghanistan, Iraq, and Kosovo and also regularly contributes to EU- and UN-led missions; Royal Netherlands Marechaussee detachments have been included in international police units deployed by NATO
the Dutch Army has especially close ties with the German Army, including having its air mobile and mechanized brigades assigned to German divisional headquarters; in addition, the Army shares with the Germans command of a NATO high-readiness corps-level headquarters, which can be ready for deployment inside or outside NATO territory within 20 days; in 2020, Belgium, Denmark, and the Netherlands formed a joint composite special operations component command
founded in the late 1400s, the Royal Netherlands Navy is one of the oldest naval forces in the World and conducts a variety of missions worldwide; in addition to its close ties with NATO, the Navy cooperates closely with the Belgian Navy, including a joint staff known as the Admiralty Benelux; it has a command responsible for the activities of Dutch naval units in the Caribbean, which includes combating drug trafficking, environmental crime, and illegal fishing, as well as providing search and rescue and disaster relief capabilities; the Netherlands has naval bases on Curaçao and Aruba; since 1973, the Dutch Marine Corps has worked closely with the British Royal Marines, including jointly in the UK-Netherlands amphibious landing force
the Dutch military is also part of the UK-led Joint Expeditionary Force, a defense framework of 10 Northern European nations designed to provide security to the High North, North Atlantic, and the Baltic Sea Region in response to a crisis (2024)
Space
Space agency/agencies
Netherlands Space Office (NSO; established 2009); Netherlands Institute for Space Research (SRON; advises NSO on scientific space research; established 1983) (2024)
Space program overview
has an active space program focused on the added value of space on science, the economy, and society, as well as the development of cutting edge space technologies and services based on satellite data; builds and operates satellites; researches and develops technologies related to astrophysics, telecommunications, remote sensing (RS), propulsion systems, atmospheric measuring instruments (such as spectrometers), planetary/exoplanetary research, and robotics; active member of the European Space Agency (ESA) and participates in the construction of ESA satellite launch vehicles (Arienne and VEGA) and in the ESA astronaut training program; participates in international space programs and with other foreign space agencies and industries, including those of Japan, the US, and members of the EU; has a robust commercial space sector tied in to the larger European space economy (2024)
note: further details about the key activities, programs, and milestones of the country’s space program, as well as government spending estimates on the space sector, appear in the Space Programs reference guide
Terrorism
Terrorist group(s)
Terrorist group(s): Islamic State of Iraq and ash-Sham (ISIS)
note: details about the history, aims, leadership, organization, areas of operation, tactics, targets, weapons, size, and sources of support of the group(s) appear(s) in the Terrorism reference guide
Transnational Issues
Refugees and internally displaced persons
refugees (country of origin): 53,496 (Syria), 19,204 (Eritrea), 7,106 (Turkey), 5,593 (Iran), 5,152 (Iraq) (mid-year 2022); 117,950 (Ukraine) (as of 21 February 2024)
stateless persons: 4,570 (2022)
Illicit drugs
a major transit hub for illicit substances, especially cocaine from South and Central America and methamphetamine from Mexico; homegrown synthetic drug makers and illegal chemical precursor manufacturers selling dangerous drugs, including synthetic opioids, via the internet to customers in the United States and worldwide