.
Nigeria

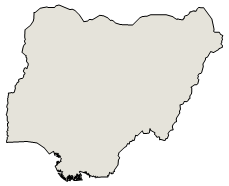
Nigeria (Africa)
Introduction :: Nigeria
Background: This entry usually highlights major historic events and current issues and may include a statement about one or two key future trends. Background field listing
British influence and control over what would become Nigeria and Africa's most populous country grew through the 19th century. A series of constitutions after World War II granted Nigeria greater autonomy. After independence in 1960, politics were marked by coups and mostly military rule, until the death of a military head of state in 1998 allowed for a political transition. In 1999, a new constitution was adopted and a peaceful transition to civilian government was completed. The government continues to face the daunting task of institutionalizing democracy and reforming a petroleum-based economy, whose revenues have been squandered through decades of corruption and mismanagement. In addition, Nigeria continues to experience longstanding ethnic and religious tensions. Although both the 2003 and 2007 presidential elections were marred by significant irregularities and violence, Nigeria is currently experiencing its longest period of civilian rule since independence. The general elections of 2007 marked the first civilian-to-civilian transfer of power in the country's history. National and state elections in 2011 and 2015 were generally regarded as credible. The 2015 election was also heralded for the fact that the then-umbrella opposition party, the All Progressives Congress, defeated the long-ruling People's Democratic Party that had governed since 1999, and assumed the presidency, marking the first peaceful transfer of power from one party to another. Presidential and legislative elections were held in early 2019 and deemed broadly free and fair despite voting irregularities, intimidation, and violence.
Geography :: Nigeria
Location: This entry identifies the country's regional location, neighboring countries, and adjacent bodies of water. Location field listing
Western Africa, bordering the Gulf of Guinea, between Benin and Cameroon
Geographic coordinates: This entry includes rounded latitude and longitude figures for the centroid or center point of a country expressed in degrees and minutes; it is based on the locations provided in the Geographic Names Server (GNS), maintained by the National Geospatial-Intelligence Agency on behalf of the US Board on Geographic Names. Geographic coordinates field listing
10 00 N, 8 00 E
Map references: This entry includes the name of the Factbook reference map on which a country may be found. Note that boundary representations on these maps are not necessarily authoritative. The entry on Geographic coordinates may be helpful in finding some smaller countries. Map references field listing
Africa
Area: This entry includes three subfields. Total area is the sum of all land and water areas delimited by international boundaries and/or coastlines. Land area is the aggregate of all surfaces delimited by international boundaries and/or coastlines, excluding inland water bodies (lakes, reservoirs, rivers). Water area is the sum of the surfaces of all inland water bodies, such as lakes, reservoirs, or rivers, as delimited by international boundaries and/or coastlines. Area field listing
total: 923,768 sq km
land: 910,768 sq km
water: 13,000 sq km
country comparison to the world: 33
Area - comparative: This entry provides an area comparison based on total area equivalents. Most entities are compared with the entire US or one of the 50 states based on area measurements (1990 revised) provided by the US Bureau of the Census. The smaller entities are compared with Washington, DC (178 sq km, 69 sq mi) or The Mall in Washington, DC (0.59 sq km, 0.23 sq mi, 146 acres). Area - comparative field listing
about six times the size of Georgia; slightly more than twice the size of California
Area comparison map: Area comparison map
Land boundaries: This entry contains the total length of all land boundaries and the individual lengths for each of the contiguous border countries. When available, official lengths published by national statistical agencies are used. Because surveying methods may differ, country border lengths reported by contiguous countries may differ. Land boundaries field listing
total: 4,477 km
border countries (4): Benin 809 km, Cameroon 1975 km, Chad 85 km, Niger 1608 km
Coastline: This entry gives the total length of the boundary between the land area (including islands) and the sea. Coastline field listing
853 km
Maritime claims: This entry includes the following claims, the definitions of which are excerpted from the United Nations Convention on the Law of the Sea (UNCLOS), which alone contains the full and definitive descriptions: territorial sea - the sovereignty of a coastal state extends beyond its land territory and internal waters to an adjacent belt of sea, described as the territorial sea in the UNCLOS (Part II); this sovereignty extends to the air space over the territorial sea as well as its underlying s . . . more Maritime claims field listing
territorial sea: 12 nm
exclusive economic zone: 200 nm
continental shelf: 200-m depth or to the depth of exploitation
Climate: This entry includes a brief description of typical weather regimes throughout the year; in the Word entry only, it includes four subfields that describe climate extremes:ten driest places on earth (average annual precipitation) describes the annual average precipitation measured in both millimeters and inches for selected countries with climate extremes. ten wettest places on earth (average annual precipitation) describes the annual average precipitation measured in both millimeters and i . . . more Climate field listing
varies; equatorial in south, tropical in center, arid in north
Terrain: This entry contains a brief description of the topography. Terrain field listing
southern lowlands merge into central hills and plateaus; mountains in southeast, plains in north
Elevation: This entry includes the mean elevation and elevation extremes, lowest point and highest point. Elevation field listing
mean elevation: 380 m
lowest point: Atlantic Ocean 0 m
highest point: Chappal Waddi 2,419 m
Natural resources: This entry lists a country's mineral, petroleum, hydropower, and other resources of commercial importance, such as rare earth elements (REEs). In general, products appear only if they make a significant contribution to the economy, or are likely to do so in the future. Natural resources field listing
natural gas, petroleum, tin, iron ore, coal, limestone, niobium, lead, zinc, arable land
Land use: This entry contains the percentage shares of total land area for three different types of land use: agricultural land, forest, and other; agricultural land is further divided into arable land - land cultivated for crops like wheat, maize, and rice that are replanted after each harvest, permanent crops - land cultivated for crops like citrus, coffee, and rubber that are not replanted after each harvest, and includes land under flowering shrubs, fruit trees, nut trees, and vines, and permane . . . more Land use field listing
agricultural land: 78% (2011 est.)
arable land: 37.3% (2011 est.) / permanent crops: 7.4% (2011 est.) / permanent pasture: 33.3% (2011 est.)
forest: 9.5% (2011 est.)
other: 12.5% (2011 est.)
Irrigated land: This entry gives the number of square kilometers of land area that is artificially supplied with water. Irrigated land field listing
2,930 sq km (2012)
Population distribution: This entry provides a summary description of the population dispersion within a country. While it may suggest population density, it does not provide density figures. Population distribution field listing
largest population of any African nation; significant population clusters are scattered throughout the country, with the highest density areas being in the south and southwest
Natural hazards: This entry lists potential natural disasters. For countries where volcanic activity is common, a volcanism subfield highlights historically active volcanoes. Natural hazards field listing
periodic droughts; flooding
Environment - current issues: This entry lists the most pressing and important environmental problems. The following terms and abbreviations are used throughout the entry: Acidification - the lowering of soil and water pH due to acid precipitation and deposition usually through precipitation; this process disrupts ecosystem nutrient flows and may kill freshwater fish and plants dependent on more neutral or alkaline conditions (see acid rain). Acid rain - characterized as containing harmful levels of sulfur dioxi . . . more Environment - current issues field listing
serious overpopulation and rapid urbanization have led to numerous environmental problems; urban air and water pollution; rapid deforestation; soil degradation; loss of arable land; oil pollution - water, air, and soil have suffered serious damage from oil spills
Environment - international agreements: This entry separates country participation in international environmental agreements into two levels - party to and signed, but not ratified. Agreements are listed in alphabetical order by the abbreviated form of the full name. Environment - international agreements field listing
party to: Biodiversity, Climate Change, Climate Change-Kyoto Protocol, Desertification, Endangered Species, Hazardous Wastes, Law of the Sea, Marine Dumping, Marine Life Conservation, Ozone Layer Protection, Ship Pollution, Wetlands
signed, but not ratified: none of the selected agreements
Geography - note: This entry includes miscellaneous geographic information of significance not included elsewhere. Geography - note field listing
the Niger River enters the country in the northwest and flows southward through tropical rain forests and swamps to its delta in the Gulf of Guinea
People and Society :: Nigeria
Population: This entry gives an estimate from the US Bureau of the Census based on statistics from population censuses, vital statistics registration systems, or sample surveys pertaining to the recent past and on assumptions about future trends. The total population presents one overall measure of the potential impact of the country on the world and within its region. Note: Starting with the 1993 Factbook, demographic estimates for some countries (mostly African) have explicitly taken into account t . . . more Population field listing
214,028,302 (July 2020 est.)
note: estimates for this country explicitly take into account the effects of excess mortality due to AIDS; this can result in lower life expectancy, higher infant mortality, higher death rates, lower population growth rates, and changes in the distribution of population by age and sex than would otherwise be expected
country comparison to the world: 6
Nationality: This entry provides the identifying terms for citizens - noun and adjective. Nationality field listing
noun: Nigerian(s)
adjective: Nigerian
Ethnic groups: This entry provides an ordered listing of ethnic groups starting with the largest and normally includes the percent of total population. Ethnic groups field listing
Hausa 30%, Yoruba 15.5%, Igbo (Ibo) 15.2%, Fulani 6%, Tiv 2.4%, Kanuri/Beriberi 2.4%, Ibibio 1.8%, Ijaw/Izon 1.8%, other 24.7% (2018 est.)
note: Nigeria, Africa's most populous country, is composed of more than 250 ethnic groups
Languages: This entry provides a listing of languages spoken in each country and specifies any that are official national or regional languages. When data is available, the languages spoken in each country are broken down according to the percent of the total population speaking each language as a first language. For those countries without available data, languages are listed in rank order based on prevalence, starting with the most-spoken language. Languages field listing
English (official), Hausa, Yoruba, Igbo (Ibo), Fulani, over 500 additional indigenous languages
Religions: This entry is an ordered listing of religions by adherents starting with the largest group and sometimes includes the percent of total population. The core characteristics and beliefs of the world's major religions are described below. Baha'i - Founded by Mirza Husayn-Ali (known as Baha'u'llah) in Iran in 1852, Baha'i faith emphasizes monotheism and believes in one eternal transcendent God. Its guiding focus is to encourage the unity of all peoples on the earth so that justice and peace m . . . more Religions field listing
Muslim 53.5%, Roman Catholic 10.6%, other Christian 35.3%, other .6% (2018 est.)
Demographic profile: This entry describes a country’s key demographic features and trends and how they vary among regional, ethnic, and socioeconomic sub-populations. Some of the topics addressed are population age structure, fertility, health, mortality, poverty, education, and migration. Demographic profile field listing
Nigeria’s population is projected to grow from more than 186 million people in 2016 to 392 million in 2050, becoming the world’s fourth most populous country. Nigeria’s sustained high population growth rate will continue for the foreseeable future because of population momentum and its high birth rate. Abuja has not successfully implemented family planning programs to reduce and space births because of a lack of political will, government financing, and the availability and affordability of services and products, as well as a cultural preference for large families. Increased educational attainment, especially among women, and improvements in health care are needed to encourage and to better enable parents to opt for smaller families.
Nigeria needs to harness the potential of its burgeoning youth population in order to boost economic development, reduce widespread poverty, and channel large numbers of unemployed youth into productive activities and away from ongoing religious and ethnic violence. While most movement of Nigerians is internal, significant emigration regionally and to the West provides an outlet for Nigerians looking for economic opportunities, seeking asylum, and increasingly pursuing higher education. Immigration largely of West Africans continues to be insufficient to offset emigration and the loss of highly skilled workers. Nigeria also is a major source, transit, and destination country for forced labor and sex trafficking.
Age structure: This entry provides the distribution of the population according to age. Information is included by sex and age group as follows: 0-14 years (children), 15-24 years (early working age), 25-54 years (prime working age), 55-64 years (mature working age), 65 years and over (elderly). The age structure of a population affects a nation's key socioeconomic issues. Countries with young populations (high percentage under age 15) need to invest more in schools, while countries with older population . . . more Age structure field listing
0-14 years: 41.7% (male 45,571,738/female 43,674,769)
15-24 years: 20.27% (male 22,022,660/female 21,358,753)
25-54 years: 30.6% (male 32,808,913/female 32,686,474)
55-64 years: 4.13% (male 4,327,847/female 4,514,264)
65 years and over: 3.3% (male 3,329,083/female 3,733,801) (2020 est.)
population pyramid: population pyramid
Dependency ratios: Dependency ratios are a measure of the age structure of a population. They relate the number of individuals that are likely to be economically "dependent" on the support of others. Dependency ratios contrast the ratio of youths (ages 0-14) and the elderly (ages 65+) to the number of those in the working-age group (ages 15-64). Changes in the dependency ratio provide an indication of potential social support requirements resulting from changes in population age structures. As fertility leve . . . more Dependency ratios field listing
total dependency ratio: 86
youth dependency ratio: 80.9
elderly dependency ratio: 5.1
potential support ratio: 19.6 (2020 est.)
Median age: This entry is the age that divides a population into two numerically equal groups; that is, half the people are younger than this age and half are older. It is a single index that summarizes the age distribution of a population. Currently, the median age ranges from a low of about 15 in Niger and Uganda to 40 or more in several European countries and Japan. See the entry for "Age structure" for the importance of a young versus an older age structure and, by implication, a low versus a high . . . more Median age field listing
total: 18.6 years
male: 18.4 years
female: 18.9 years (2020 est.)
country comparison to the world: 208
Population growth rate: The average annual percent change in the population, resulting from a surplus (or deficit) of births over deaths and the balance of migrants entering and leaving a country. The rate may be positive or negative. The growth rate is a factor in determining how great a burden would be imposed on a country by the changing needs of its people for infrastructure (e.g., schools, hospitals, housing, roads), resources (e.g., food, water, electricity), and jobs. Rapid population growth can be seen as . . . more Population growth rate field listing
2.53% (2020 est.)
country comparison to the world: 23
Birth rate: This entry gives the average annual number of births during a year per 1,000 persons in the population at midyear; also known as crude birth rate. The birth rate is usually the dominant factor in determining the rate of population growth. It depends on both the level of fertility and the age structure of the population. Birth rate field listing
34.6 births/1,000 population (2020 est.)
country comparison to the world: 21
Death rate: This entry gives the average annual number of deaths during a year per 1,000 population at midyear; also known as crude death rate. The death rate, while only a rough indicator of the mortality situation in a country, accurately indicates the current mortality impact on population growth. This indicator is significantly affected by age distribution, and most countries will eventually show a rise in the overall death rate, in spite of continued decline in mortality at all ages, as declining . . . more Death rate field listing
9.1 deaths/1,000 population (2020 est.)
country comparison to the world: 59
Net migration rate: This entry includes the figure for the difference between the number of persons entering and leaving a country during the year per 1,000 persons (based on midyear population). An excess of persons entering the country is referred to as net immigration (e.g., 3.56 migrants/1,000 population); an excess of persons leaving the country as net emigration (e.g., -9.26 migrants/1,000 population). The net migration rate indicates the contribution of migration to the overall level of population chan . . . more Net migration rate field listing
-0.2 migrant(s)/1,000 population (2020 est.)
country comparison to the world: 108
Population distribution: This entry provides a summary description of the population dispersion within a country. While it may suggest population density, it does not provide density figures. Population distribution field listing
largest population of any African nation; significant population clusters are scattered throughout the country, with the highest density areas being in the south and southwest
Urbanization: This entry provides two measures of the degree of urbanization of a population. The first, urban population, describes the percentage of the total population living in urban areas, as defined by the country. The second, rate of urbanization, describes the projected average rate of change of the size of the urban population over the given period of time. It is possible for a country with a 100% urban population to still display a change in the rate of urbanization (up or down). For example . . . more Urbanization field listing
urban population: 52% of total population (2020)
rate of urbanization: 4.23% annual rate of change (2015-20 est.)
Major urban areas - population: This entry provides the population of the capital and up to six major cities defined as urban agglomerations with populations of at least 750,000 people. An urban agglomeration is defined as comprising the city or town proper and also the suburban fringe or thickly settled territory lying outside of, but adjacent to, the boundaries of the city. For smaller countries, lacking urban centers of 750,000 or more, only the population of the capital is presented. Major urban areas - population field listing
14.368 million Lagos, 3.999 million Kano, 3.552 million Ibadan, 3.278 million ABUJA (capital), 3.020 million Port Harcourt, 1.727 million Benin City (2020)
Sex ratio: This entry includes the number of males for each female in five age groups - at birth, under 15 years, 15-64 years, 65 years and over, and for the total population. Sex ratio at birth has recently emerged as an indicator of certain kinds of sex discrimination in some countries. For instance, high sex ratios at birth in some Asian countries are now attributed to sex-selective abortion and infanticide due to a strong preference for sons. This will affect future marriage patterns and fertilit . . . more Sex ratio field listing
at birth: 1.06 male(s)/female
0-14 years: 1.04 male(s)/female
15-24 years: 1.03 male(s)/female
25-54 years: 1 male(s)/female
55-64 years: 0.96 male(s)/female
65 years and over: 0.89 male(s)/female
total population: 1.02 male(s)/female (2020 est.)
Mother's mean age at first birth: This entry provides the mean (average) age of mothers at the birth of their first child. It is a useful indicator for gauging the success of family planning programs aiming to reduce maternal mortality, increase contraceptive use – particularly among married and unmarried adolescents – delay age at first marriage, and improve the health of newborns. Mother's mean age at first birth field listing
20.3 years (2013 est.)
note: median age at first birth among women 25-29
Maternal mortality rate: The maternal mortality rate (MMR) is the annual number of female deaths per 100,000 live births from any cause related to or aggravated by pregnancy or its management (excluding accidental or incidental causes). The MMR includes deaths during pregnancy, childbirth, or within 42 days of termination of pregnancy, irrespective of the duration and site of the pregnancy, for a specified year. Maternal mortality rate field listing
917 deaths/100,000 live births (2017 est.)
country comparison to the world: 4
Infant mortality rate: This entry gives the number of deaths of infants under one year old in a given year per 1,000 live births in the same year. This rate is often used as an indicator of the level of health in a country. Infant mortality rate field listing
total: 59.8 deaths/1,000 live births
male: 65.4 deaths/1,000 live births
female: 54 deaths/1,000 live births (2020 est.)
country comparison to the world: 12
Life expectancy at birth: This entry contains the average number of years to be lived by a group of people born in the same year, if mortality at each age remains constant in the future. Life expectancy at birth is also a measure of overall quality of life in a country and summarizes the mortality at all ages. It can also be thought of as indicating the potential return on investment in human capital and is necessary for the calculation of various actuarial measures. Life expectancy at birth field listing
total population: 60.4 years
male: 58.6 years
female: 62.3 years (2020 est.)
country comparison to the world: 217
Total fertility rate: This entry gives a figure for the average number of children that would be born per woman if all women lived to the end of their childbearing years and bore children according to a given fertility rate at each age. The total fertility rate (TFR) is a more direct measure of the level of fertility than the crude birth rate, since it refers to births per woman. This indicator shows the potential for population change in the country. A rate of two children per woman is considered the replaceme . . . more Total fertility rate field listing
4.72 children born/woman (2020 est.)
country comparison to the world: 18
Contraceptive prevalence rate: This field gives the percent of women of reproductive age (15-49) who are married or in union and are using, or whose sexual partner is using, a method of contraception according to the date of the most recent available data. The contraceptive prevalence rate is an indicator of health services, development, and women’s empowerment. It is also useful in understanding, past, present, and future fertility trends, especially in developing countries. Contraceptive prevalence rate field listing
27.6% (2018)
Drinking water source: This entry provides information about access to improved or unimproved drinking water sources available to segments of the population of a country. Improved drinking water - use of any of the following sources: piped water into dwelling, yard, or plot; public tap or standpipe; tubewell or borehole; protected dug well; protected spring; or rainwater collection. Unimproved drinking water - use of any of the following sources: unprotected dug well; unprotected spring; cart with small tank or . . . more Drinking water source field listing
improved: urban: 80.8% of population
rural: 57.3% of population
total: 68.5% of population
unimproved: urban: 19.2% of population
rural: 42.7% of population
total: 31.5% of population (2015 est.)
Current Health Expenditure: Current Health Expenditure (CHE) describes the share of spending on health in each country relative to the size of its economy. It includes expenditures corresponding to the final consumption of health care goods and services and excludes investment, exports, and intermediate consumption. CHE shows the importance of the health sector in the economy and indicates the priority given to health in monetary terms. Note: Current Health Expenditure replaces the former Health Expenditures field . . . more Current Health Expenditure field listing
3.8% (2017)
Physicians density: This entry gives the number of medical doctors (physicians), including generalist and specialist medical practitioners, per 1,000 of the population. Medical doctors are defined as doctors that study, diagnose, treat, and prevent illness, disease, injury, and other physical and mental impairments in humans through the application of modern medicine. They also plan, supervise, and evaluate care and treatment plans by other health care providers. The World Health Organization estimates that f . . . more Physicians density field listing
0.38 physicians/1,000 population (2013)
Sanitation facility access: This entry provides information about access to improved or unimproved sanitation facilities available to segments of the population of a country. Improved sanitation - use of any of the following facilities: flush or pour-flush to a piped sewer system, septic tank or pit latrine; ventilated improved pit (VIP) latrine; pit latrine with slab; or a composting toilet. Unimproved sanitation - use of any of the following facilities: flush or pour-flush not piped to a sewer system, septic tank . . . more Sanitation facility access field listing
improved: urban: 32.8% of population (2015 est.)
rural: 25.4% of population (2015 est.)
total: 29% of population (2015 est.)
unimproved: urban: 67.2% of population (2015 est.)
rural: 74.6% of population (2015 est.)
total: 71% of population (2015 est.)
HIV/AIDS - adult prevalence rate: This entry gives an estimate of the percentage of adults (aged 15-49) living with HIV/AIDS. The adult prevalence rate is calculated by dividing the estimated number of adults living with HIV/AIDS at yearend by the total adult population at yearend. HIV/AIDS - adult prevalence rate field listing
1.5% (2018 est.)
country comparison to the world: 31
HIV/AIDS - people living with HIV/AIDS: This entry gives an estimate of all people (adults and children) alive at yearend with HIV infection, whether or not they have developed symptoms of AIDS. HIV/AIDS - people living with HIV/AIDS field listing
1.9 million (2018 est.)
country comparison to the world: 4
HIV/AIDS - deaths: This entry gives an estimate of the number of adults and children who died of AIDS during a given calendar year. HIV/AIDS - deaths field listing
53,200 (2017 est.)
country comparison to the world: 4
Major infectious diseases: This entry lists major infectious diseases likely to be encountered in countries where the risk of such diseases is assessed to be very high as compared to the United States. These infectious diseases represent risks to US government personnel traveling to the specified country for a period of less than three years. The degree of risk is assessed by considering the foreign nature of these infectious diseases, their severity, and the probability of being affected by the diseases present. Th . . . more Major infectious diseases field listing
degree of risk: very high (2020)
food or waterborne diseases: bacterial and protozoal diarrhea, hepatitis A and E, and typhoid fever
vectorborne diseases: malaria, dengue fever, and yellow fever
water contact diseases: leptospirosis and schistosomiasis
animal contact diseases: rabies
respiratory diseases: meningococcal meningitis
aerosolized dust or soil contact diseases: Lassa fever
note - on 7 October 2019, the Centers for Disease Control and Prevention issued a Travel Health Notice for a Yellow Fever outbreak in Nigeria; a large, ongoing outbreak of yellow fever in Nigeria began in September 2017; the outbreak is now spread throughout the country with the Nigerian Ministry of Health reporting cases of the disease in all 36 states and the Federal Capital Territory; the CDC recommends travelers going to Nigeria should receive vaccination against yellow fever at least 10 days before travel and should take steps to prevent mosquito bites while there; those never vaccinated against yellow fever should avoid travel to Nigeria during the outbreak
Obesity - adult prevalence rate: This entry gives the percent of a country's population considered to be obese. Obesity is defined as an adult having a Body Mass Index (BMI) greater to or equal to 30.0. BMI is calculated by taking a person's weight in kg and dividing it by the person's squared height in meters. Obesity - adult prevalence rate field listing
8.9% (2016)
country comparison to the world: 145
Children under the age of 5 years underweight: This entry gives the percent of children under five considered to be underweight. Underweight means weight-for-age is approximately 2 kg below for standard at age one, 3 kg below standard for ages two and three, and 4 kg below standard for ages four and five. This statistic is an indicator of the nutritional status of a community. Children who suffer from growth retardation as a result of poor diets and/or recurrent infections tend to have a greater risk of suffering illness and death. Children under the age of 5 years underweight field listing
31.5% (2016)
country comparison to the world: 8
Education expenditures: This entry provides the public expenditure on education as a percent of GDP. Education expenditures field listing
NA
Literacy: This entry includes a definition of literacy and UNESCO's percentage estimates for populations aged 15 years and over, including total population, males, and females. There are no universal definitions and standards of literacy. Unless otherwise specified, all rates are based on the most common definition - the ability to read and write at a specified age. Detailing the standards that individual countries use to assess the ability to read and write is beyond the scope of the Factbook. Info . . . more Literacy field listing
definition: age 15 and over can read and write
total population: 62%
male: 71.3%
female: 52.7% (2018)
School life expectancy (primary to tertiary education): School life expectancy (SLE) is the total number of years of schooling (primary to tertiary) that a child can expect to receive, assuming that the probability of his or her being enrolled in school at any particular future age is equal to the current enrollment ratio at that age. Caution must be maintained when utilizing this indicator in international comparisons. For example, a year or grade completed in one country is not necessarily the same in terms of educational content or qualit . . . more School life expectancy (primary to tertiary education) field listing
total: 9 years
male: 9 years
female: 8 years (2011)
Unemployment, youth ages 15-24: This entry gives the percent of the total labor force ages 15-24 unemployed during a specified year. Unemployment, youth ages 15-24 field listing
total: 13.8%
male: NA
female: NA (2016 est.)
country comparison to the world: 100
Government :: Nigeria
Country name: This entry includes all forms of the country's name approved by the US Board on Geographic Names (Italy is used as an example): conventional long form (Italian Republic), conventional short form (Italy), local long form (Repubblica Italiana), local short form (Italia), former (Kingdom of Italy), as well as the abbreviation. Also see the Terminology note. Country name field listing
conventional long form: Federal Republic of Nigeria
conventional short form: Nigeria
etymology: named for the Niger River that flows through the west of the country to the Atlantic Ocean; from a native term "Ni Gir" meaning "River Gir"
Government type: This entry gives the basic form of government. Definitions of the major governmental terms are as follows. (Note that for some countries more than one definition applies.): Absolute monarchy - a form of government where the monarch rules unhindered, i.e., without any laws, constitution, or legally organized opposition. Anarchy - a condition of lawlessness or political disorder brought about by the absence of governmental authority. Authoritarian - a form of government in whic . . . more Government type field listing
federal presidential republic
Capital: This entry gives the name of the seat of government, its geographic coordinates, the time difference relative to Coordinated Universal Time (UTC) and the time observed in Washington, DC, and, if applicable, information on daylight saving time (DST). Where appropriate, a special note has been added to highlight those countries that have multiple time zones. Capital field listing
name: Abuja
geographic coordinates: 9 05 N, 7 32 E
time difference: UTC+1 (6 hours ahead of Washington, DC, during Standard Time)
etymology: Abuja is a planned capital city, it replaced Lagos in 1991; situated in the center of the country, Abuja takes its name from a nearby town, now renamed Suleja
Administrative divisions: This entry generally gives the numbers, designatory terms, and first-order administrative divisions as approved by the US Board on Geographic Names (BGN). Changes that have been reported but not yet acted on by the BGN are noted. Geographic names conform to spellings approved by the BGN with the exception of the omission of diacritical marks and special characters. Administrative divisions field listing
36 states and 1 territory*; Abia, Adamawa, Akwa Ibom, Anambra, Bauchi, Bayelsa, Benue, Borno, Cross River, Delta, Ebonyi, Edo, Ekiti, Enugu, Federal Capital Territory*, Gombe, Imo, Jigawa, Kaduna, Kano, Katsina, Kebbi, Kogi, Kwara, Lagos, Nasarawa, Niger, Ogun, Ondo, Osun, Oyo, Plateau, Rivers, Sokoto, Taraba, Yobe, Zamfara
Independence: For most countries, this entry gives the date that sovereignty was achieved and from which nation, empire, or trusteeship. For the other countries, the date given may not represent "independence" in the strict sense, but rather some significant nationhood event such as the traditional founding date or the date of unification, federation, confederation, establishment, fundamental change in the form of government, or state succession. For a number of countries, the establishment of statehood . . . more Independence field listing
1 October 1960 (from the UK)
National holiday: This entry gives the primary national day of celebration - usually independence day. National holiday field listing
Independence Day (National Day), 1 October (1960)
Constitution: This entry provides information on a country’s constitution and includes two subfields. The history subfield includes the dates of previous constitutions and the main steps and dates in formulating and implementing the latest constitution. For countries with 1-3 previous constitutions, the years are listed; for those with 4-9 previous, the entry is listed as “several previous,” and for those with 10 or more, the entry is “many previous.” The amendments subfield summarizes the process of am . . . more Constitution field listing
history: several previous; latest adopted 5 May 1999, effective 29 May 1999
amendments: proposed by the National Assembly; passage requires at least two-thirds majority vote of both houses and approval by the Houses of Assembly of at least two thirds of the states; amendments to constitutional articles on the creation of a new state, fundamental constitutional rights, or constitution-amending procedures requires at least four-fifths majority vote by both houses of the National Assembly and approval by the Houses of Assembly in at least two thirds of the states; passage of amendments limited to the creation of a new state require at least two-thirds majority vote by the proposing National Assembly house and approval by the Houses of Assembly in two thirds of the states; amended several times, last in 2018 (2018)
Legal system: This entry provides the description of a country's legal system. A statement on judicial review of legislative acts is also included for a number of countries. The legal systems of nearly all countries are generally modeled upon elements of five main types: civil law (including French law, the Napoleonic Code, Roman law, Roman-Dutch law, and Spanish law); common law (including United State law); customary law; mixed or pluralistic law; and religious law (including Islamic law). An addition . . . more Legal system field listing
mixed legal system of English common law, Islamic law (in 12 northern states), and traditional law
International law organization participation: This entry includes information on a country's acceptance of jurisdiction of the International Court of Justice (ICJ) and of the International Criminal Court (ICCt); 59 countries have accepted ICJ jurisdiction with reservations and 11 have accepted ICJ jurisdiction without reservations; 122 countries have accepted ICCt jurisdiction. Appendix B: International Organizations and Groups explains the differing mandates of the ICJ and ICCt. International law organization participation field listing
accepts compulsory ICJ jurisdiction with reservations; accepts ICCt jurisdiction
Citizenship: This entry provides information related to the acquisition and exercise of citizenship; it includes four subfields: citizenship by birth describes the acquisition of citizenship based on place of birth, known as Jus soli, regardless of the citizenship of parents. citizenship by descent only describes the acquisition of citizenship based on the principle of Jus sanguinis, or by descent, where at least one parent is a citizen of the state and being born within the territorial limits of the s . . . more Citizenship field listing
citizenship by birth: no
citizenship by descent only: at least one parent must be a citizen of Nigeria
dual citizenship recognized: yes
residency requirement for naturalization: 15 years
Suffrage: This entry gives the age at enfranchisement and whether the right to vote is universal or restricted. Suffrage field listing
18 years of age; universal
Executive branch: This entry includes five subentries: chief of state; head of government; cabinet; elections/appointments; election results. Chief of state includes the name, title, and beginning date in office of the titular leader of the country who represents the state at official and ceremonial functions but may not be involved with the day-to-day activities of the government. Head of government includes the name, title of the top executive designated to manage the executive branch of the government, a . . . more Executive branch field listing
chief of state: President Maj. Gen. (ret.) Muhammadu BUHARI (since 29 May 2015); Vice President Oluyemi "Yemi" OSINBAJO (since 29 May 2015); note - the president is both chief of state, head of government, and commander-in-chief of the armed forces
head of government: President Maj.Gen. (ret.) Muhammadu BUHARI (since 29 May 2015); Vice President Oluyemi "Yemi" OSINBAJO (since 29 May 2015)
cabinet: Federal Executive Council appointed by the president but constrained constitutionally to include at least one member from each of the 36 states
elections/appointments: president directly elected by qualified majority popular vote and at least 25% of the votes cast in 24 of Nigeria's 36 states; president elected for a 4-year term (eligible for a second term); election last held on 23 February 2019 (next to be held in February 2023); note: the election was scheduled for 16 February 2019, but postponed on 16 February 2019
election results: Muhammadu BUHARI elected president; percent of vote - Muhammadu BUHARI (APC) 53%, Atiku ABUBAKER (PDP) 39%, other 8%
Legislative branch: This entry has three subfields. The description subfield provides the legislative structure (unicameral – single house; bicameral – an upper and a lower house); formal name(s); number of member seats; types of constituencies or voting districts (single seat, multi-seat, nationwide); electoral voting system(s); and member term of office. The elections subfield includes the dates of the last election and next election. The election results subfield lists percent of vote by party/coalition an . . . more Legislative branch field listing
description: bicameral National Assembly consists of:
Senate (109 seats - 3 each for the 36 states and 1 for Abuja-Federal Capital Territory; members directly elected in single-seat constituencies by simple majority vote to serve 4-year terms)
House of Representatives (360 seats; members directly elected in single-seat constituencies by simple majority vote to serve 4-year terms)
elections: Senate - last held on 23 February 2019 (next to be held on 23 February 2023); note: election was scheduled for 16 February 2019 but was postponed on 15 February 2019
House of Representatives - last held on 23 February 2019 (next to be held on 23 February 2023); note: election was scheduled for 16 February 2019 but was postponed on 15 February 2019
election results: Senate - percent of vote by party - NA; seats by party - APC 65, PDP 39, YPP 1, TBD 3; composition - men 103, women 6, percent of women 5.5%
House of Representatives - percent of vote by party - NA; seats by party - APC 217, PDP 115, other 20, TBD 8; composition - men 346, women 14, percent of women 3.9%; note - total National Assembly percent of women 4.3%
Judicial branch: This entry includes three subfields. The highest court(s) subfield includes the name(s) of a country's highest level court(s), the number and titles of the judges, and the types of cases heard by the court, which commonly are based on civil, criminal, administrative, and constitutional law. A number of countries have separate constitutional courts. The judge selection and term of office subfield includes the organizations and associated officials responsible for nominating and appointing j . . . more Judicial branch field listing
highest courts: Supreme Court (consists of the chief justice and 15 justices)
judge selection and term of office: judges appointed by the president upon the recommendation of the National Judicial Council, a 23-member independent body of federal and state judicial officials; judge appointments confirmed by the Senate; judges serve until age 70
subordinate courts: Court of Appeal; Federal High Court; High Court of the Federal Capital Territory; Sharia Court of Appeal of the Federal Capital Territory; Customary Court of Appeal of the Federal Capital Territory; state court system similar in structure to federal system
Political parties and leaders: This entry includes a listing of significant political parties, coalitions, and electoral lists as of each country's last legislative election, unless otherwise noted. Political parties and leaders field listing
Accord Party or ACC [Mohammad Lawal MALADO]
All Progressives Congress or APC [Adams OSHIOMHOLE]
All Progressives Grand Alliance or APGA [Victor Ike OYE]
Democratic Peoples Party or DPP [Biodun OGUNBIYI]
Labor Party or LP [Alhai Abdulkadir ABDULSALAM]
Peoples Democratic Party or PDP [Uche SECONDUS]
Young Progressive Party or YPP [Kingsley MOGHALU]
International organization participation: This entry lists in alphabetical order by abbreviation those international organizations in which the subject country is a member or participates in some other way. International organization participation field listing
ACP, AfDB, AU, C, CD, D-8, ECOWAS, EITI (compliant country), FAO, G-15, G-24, G-77, IAEA, IBRD, ICAO, ICC (national committees), ICCt, ICRM, IDA, IDB, IFAD, IFC, IFRCS, IHO, ILO, IMF, IMO, IMSO, Interpol, IOC, IOM, IPU, ISO, ITSO, ITU, ITUC (NGOs), MIGA, MINURSO, MINUSMA, MONUSCO, NAM, OAS (observer), OIC, OPCW, OPEC, PCA, UN, UNAMID, UNCTAD, UNESCO, UNHCR, UNIDO, UNIFIL, UNISFA, UNITAR, UNMIL, UNMISS, UNOCI, UNWTO, UPU, WCO, WFTU (NGOs), WHO, WIPO, WMO, WTO
Diplomatic representation in the US: This entry includes the chief of mission, chancery address, telephone, FAX, consulate general locations, and consulate locations. The use of the annotated title Appointed Ambassador refers to a new ambassador who has presented his/her credentials to the secretary of state but not the US president. Such ambassadors fulfill all diplomatic functions except meeting with or appearing at functions attended by the president until such time as they formally present their credentials at a White Hou . . . more Diplomatic representation in the US field listing
Ambassador Sylvanus Adiewere NSOFOR (since 29 November 2017)
chancery: 3519 International Court NW, Washington, DC 20008
telephone: [1] (202) 516-4277
FAX: [1] (202) 362-6541
consulate(s) general: Atlanta, New York
Diplomatic representation from the US: This entry includes the chief of mission, embassy address, mailing address, telephone number, FAX number, branch office locations, consulate general locations, and consulate locations. Diplomatic representation from the US field listing
chief of mission: Ambassador Mary Beth LEONARD (since 24 December 2019)
telephone: [234] (9) 461-4000
embassy: Plot 1075 Diplomatic Drive, Central District Area, Abuja
mailing address: P. O. Box 5760, Garki, Abuja
FAX: [234] (9) 461-4036
consulate(s): Lagos
Flag description: This entry provides a written flag description produced from actual flags or the best information available at the time the entry was written. The flags of independent states are used by their dependencies unless there is an officially recognized local flag. Some disputed and other areas do not have flags. Flag description field listing
three equal vertical bands of green (hoist side), white, and green; the color green represents the forests and abundant natural wealth of the country, white stands for peace and unity
National symbol(s): A national symbol is a faunal, floral, or other abstract representation - or some distinctive object - that over time has come to be closely identified with a country or entity. Not all countries have national symbols; a few countries have more than one. National symbol(s) field listing
eagle; national colors: green, white
National anthem: A generally patriotic musical composition - usually in the form of a song or hymn of praise - that evokes and eulogizes the history, traditions, or struggles of a nation or its people. National anthems can be officially recognized as a national song by a country's constitution or by an enacted law, or simply by tradition. Although most anthems contain lyrics, some do not. National anthem field listing
name: Arise Oh Compatriots, Nigeria's Call Obey
lyrics/music: John A. ILECHUKWU, Eme Etim AKPAN, B.A. OGUNNAIKE, Sotu OMOIGUI and P.O. ADERIBIGBE/Benedict Elide ODIASE
note: adopted 1978; lyrics are a mixture of the five top entries in a national contest
Economy :: Nigeria
Economy - overview: This entry briefly describes the type of economy, including the degree of market orientation, the level of economic development, the most important natural resources, and the unique areas of specialization. It also characterizes major economic events and policy changes in the most recent 12 months and may include a statement about one or two key future macroeconomic trends. Economy - overview field listing
Nigeria is Sub Saharan Africa’s largest economy and relies heavily on oil as its main source of foreign exchange earnings and government revenues. Following the 2008-09 global financial crises, the banking sector was effectively recapitalized and regulation enhanced. Since then, Nigeria’s economic growth has been driven by growth in agriculture, telecommunications, and services. Economic diversification and strong growth have not translated into a significant decline in poverty levels; over 62% of Nigeria's over 180 million people still live in extreme poverty.
Despite its strong fundamentals, oil-rich Nigeria has been hobbled by inadequate power supply, lack of infrastructure, delays in the passage of legislative reforms, an inefficient property registration system, restrictive trade policies, an inconsistent regulatory environment, a slow and ineffective judicial system, unreliable dispute resolution mechanisms, insecurity, and pervasive corruption. Regulatory constraints and security risks have limited new investment in oil and natural gas, and Nigeria's oil production had been contracting every year since 2012 until a slight rebound in 2017.
President BUHARI, elected in March 2015, has established a cabinet of economic ministers that includes several technocrats, and he has announced plans to increase transparency, diversify the economy away from oil, and improve fiscal management, but has taken a primarily protectionist approach that favors domestic producers at the expense of consumers. President BUHARI ran on an anti-corruption platform, and has made some headway in alleviating corruption, such as implementation of a Treasury Single Account that allows the government to better manage its resources and a more transparent government payroll and personnel system that eliminated duplicate and "ghost workers." The government also is working to develop stronger public-private partnerships for roads, agriculture, and power.
Nigeria entered recession in 2016 as a result of lower oil prices and production, exacerbated by militant attacks on oil and gas infrastructure in the Niger Delta region, coupled with detrimental economic policies, including foreign exchange restrictions. GDP growth turned positive in 2017 as oil prices recovered and output stabilized.
GDP (purchasing power parity): This entry gives the gross domestic product (GDP) or value of all final goods and services produced within a nation in a given year. A nation's GDP at purchasing power parity (PPP) exchange rates is the sum value of all goods and services produced in the country valued at prices prevailing in the United States in the year noted. This is the measure most economists prefer when looking at per-capita welfare and when comparing living conditions or use of resources across countries. The measur . . . more GDP (purchasing power parity) field listing
$1.121 trillion (2017 est.)
$1.112 trillion (2016 est.)
$1.13 trillion (2015 est.)
note: data are in 2017 dollars
country comparison to the world: 24
GDP (official exchange rate): This entry gives the gross domestic product (GDP) or value of all final goods and services produced within a nation in a given year. A nation's GDP at official exchange rates (OER) is the home-currency-denominated annual GDP figure divided by the bilateral average US exchange rate with that country in that year. The measure is simple to compute and gives a precise measure of the value of output. Many economists prefer this measure when gauging the economic power an economy maintains vis- . . . more GDP (official exchange rate) field listing
$376.4 billion (2017 est.)
GDP - real growth rate: This entry gives GDP growth on an annual basis adjusted for inflation and expressed as a percent. The growth rates are year-over-year, and not compounded. GDP - real growth rate field listing
0.8% (2017 est.)
-1.6% (2016 est.)
2.7% (2015 est.)
country comparison to the world: 187
GDP - per capita (PPP): This entry shows GDP on a purchasing power parity basis divided by population as of 1 July for the same year. GDP - per capita (PPP) field listing
$5,900 (2017 est.)
$6,100 (2016 est.)
$6,300 (2015 est.)
note: data are in 2017 dollars
country comparison to the world: 166
Gross national saving: Gross national saving is derived by deducting final consumption expenditure (household plus government) from Gross national disposable income, and consists of personal saving, plus business saving (the sum of the capital consumption allowance and retained business profits), plus government saving (the excess of tax revenues over expenditures), but excludes foreign saving (the excess of imports of goods and services over exports). The figures are presented as a percent of GDP. A negative . . . more Gross national saving field listing
18.2% of GDP (2017 est.)
16% of GDP (2016 est.)
12.3% of GDP (2015 est.)
country comparison to the world: 110
GDP - composition, by end use: This entry shows who does the spending in an economy: consumers, businesses, government, and foreigners. The distribution gives the percentage contribution to total GDP of household consumption, government consumption, investment in fixed capital, investment in inventories, exports of goods and services, and imports of goods and services, and will total 100 percent of GDP if the data are complete. household consumption consists of expenditures by resident households, and by nonprofit insti . . . more GDP - composition, by end use field listing
household consumption: 80% (2017 est.)
government consumption: 5.8% (2017 est.)
investment in fixed capital: 14.8% (2017 est.)
investment in inventories: 0.7% (2017 est.)
exports of goods and services: 11.9% (2017 est.)
imports of goods and services: -13.2% (2017 est.)
GDP - composition, by sector of origin: This entry shows where production takes place in an economy. The distribution gives the percentage contribution of agriculture, industry, and services to total GDP, and will total 100 percent of GDP if the data are complete. Agriculture includes farming, fishing, and forestry. Industry includes mining, manufacturing, energy production, and construction. Services cover government activities, communications, transportation, finance, and all other private economic activities that do not prod . . . more GDP - composition, by sector of origin field listing
agriculture: 21.1% (2016 est.)
industry: 22.5% (2016 est.)
services: 56.4% (2017 est.)
Agriculture - products: This entry is an ordered listing of major crops and products starting with the most important. Agriculture - products field listing
cocoa, peanuts, cotton, palm oil, corn, rice, sorghum, millet, cassava (manioc, tapioca), yams, rubber; cattle, sheep, goats, pigs; timber; fish
Industries: This entry provides a rank ordering of industries starting with the largest by value of annual output. Industries field listing
crude oil, coal, tin, columbite; rubber products, wood; hides and skins, textiles, cement and other construction materials, food products, footwear, chemicals, fertilizer, printing, ceramics, steel
Industrial production growth rate: This entry gives the annual percentage increase in industrial production (includes manufacturing, mining, and construction). Industrial production growth rate field listing
2.2% (2017 est.)
country comparison to the world: 126
Labor force: This entry contains the total labor force figure. Labor force field listing
60.08 million (2017 est.)
country comparison to the world: 10
Labor force - by occupation: This entry lists the percentage distribution of the labor force by sector of occupation. Agriculture includes farming, fishing, and forestry. Industry includes mining, manufacturing, energy production, and construction. Services cover government activities, communications, transportation, finance, and all other economic activities that do not produce material goods. The distribution will total less than 100 percent if the data are incomplete and may range from 99-101 percent due to rounding. more Labor force - by occupation field listing
agriculture: 70%
industry: 10%
services: 20% (1999 est.)
Unemployment rate: This entry contains the percent of the labor force that is without jobs. Substantial underemployment might be noted. Unemployment rate field listing
16.5% (2017 est.)
13.9% (2016 est.)
country comparison to the world: 178
Population below poverty line: National estimates of the percentage of the population falling below the poverty line are based on surveys of sub-groups, with the results weighted by the number of people in each group. Definitions of poverty vary considerably among nations. For example, rich nations generally employ more generous standards of poverty than poor nations. Population below poverty line field listing
70% (2010 est.)
Household income or consumption by percentage share: Data on household income or consumption come from household surveys, the results adjusted for household size. Nations use different standards and procedures in collecting and adjusting the data. Surveys based on income will normally show a more unequal distribution than surveys based on consumption. The quality of surveys is improving with time, yet caution is still necessary in making inter-country comparisons. Household income or consumption by percentage share field listing
lowest 10%: 1.8%
highest 10%: 38.2% (2010 est.)
Budget: This entry includes revenues, expenditures, and capital expenditures. These figures are calculated on an exchange rate basis, i.e., not in purchasing power parity (PPP) terms. Budget field listing
revenues: 12.92 billion (2017 est.)
expenditures: 19.54 billion (2017 est.)
Taxes and other revenues: This entry records total taxes and other revenues received by the national government during the time period indicated, expressed as a percent of GDP. Taxes include personal and corporate income taxes, value added taxes, excise taxes, and tariffs. Other revenues include social contributions - such as payments for social security and hospital insurance - grants, and net revenues from public enterprises. Normalizing the data, by dividing total revenues by GDP, enables easy comparisons acr . . . more Taxes and other revenues field listing
3.4% (of GDP) (2017 est.)
country comparison to the world: 220
Budget surplus (+) or deficit (-): This entry records the difference between national government revenues and expenditures, expressed as a percent of GDP. A positive (+) number indicates that revenues exceeded expenditures (a budget surplus), while a negative (-) number indicates the reverse (a budget deficit). Normalizing the data, by dividing the budget balance by GDP, enables easy comparisons across countries and indicates whether a national government saves or borrows money. Countries with high budget deficits (relat . . . more Budget surplus (+) or deficit (-) field listing
-1.8% (of GDP) (2017 est.)
country comparison to the world: 99
Public debt: This entry records the cumulative total of all government borrowings less repayments that are denominated in a country's home currency. Public debt should not be confused with external debt, which reflects the foreign currency liabilities of both the private and public sector and must be financed out of foreign exchange earnings. Public debt field listing
21.8% of GDP (2017 est.)
19.6% of GDP (2016 est.)
country comparison to the world: 185
Fiscal year: This entry identifies the beginning and ending months for a country's accounting period of 12 months, which often is the calendar year but which may begin in any month. All yearly references are for the calendar year (CY) unless indicated as a noncalendar fiscal year (FY). Fiscal year field listing
calendar year
Inflation rate (consumer prices): This entry furnishes the annual percent change in consumer prices compared with the previous year's consumer prices. Inflation rate (consumer prices) field listing
16.5% (2017 est.)
15.7% (2016 est.)
country comparison to the world: 213
Current account balance: This entry records a country's net trade in goods and services, plus net earnings from rents, interest, profits, and dividends, and net transfer payments (such as pension funds and worker remittances) to and from the rest of the world during the period specified. These figures are calculated on an exchange rate basis, i.e., not in purchasing power parity (PPP) terms. Current account balance field listing
$10.38 billion (2017 est.)
$2.714 billion (2016 est.)
country comparison to the world: 21
Exports: This entry provides the total US dollar amount of merchandise exports on an f.o.b. (free on board) basis. These figures are calculated on an exchange rate basis, i.e., not in purchasing power parity (PPP) terms. Exports field listing
$1.146 billion (2017 est.)
$34.7 billion (2016 est.)
country comparison to the world: 154
Exports - partners: This entry provides a rank ordering of trading partners starting with the most important; it sometimes includes the percent of total dollar value. Exports - partners field listing
India 30.6%, US 12.1%, Spain 6.6%, China 5.6%, France 5.5%, Netherlands 4.4%, Indonesia 4.4% (2017)
Exports - commodities: This entry provides a listing of the highest-valued exported products; it sometimes includes the percent of total dollar value. Exports - commodities field listing
petroleum and petroleum products 95%, cocoa, rubber (2012 est.)
Imports: This entry provides the total US dollar amount of merchandise imports on a c.i.f. (cost, insurance, and freight) or f.o.b. (free on board) basis. These figures are calculated on an exchange rate basis, i.e., not in purchasing power parity (PPP) terms. Imports field listing
$32.67 billion (2017 est.)
$35.24 billion (2016 est.)
country comparison to the world: 62
Imports - commodities: This entry provides a listing of the highest-valued imported products; it sometimes includes the percent of total dollar value. Imports - commodities field listing
machinery, chemicals, transport equipment, manufactured goods, food and live animals
Imports - partners: This entry provides a rank ordering of trading partners starting with the most important; it sometimes includes the percent of total dollar value. Imports - partners field listing
China 21.1%, Belgium 8.7%, US 8.4%, South Korea 7.5%, UK 4.4% (2017)
Reserves of foreign exchange and gold: This entry gives the dollar value for the stock of all financial assets that are available to the central monetary authority for use in meeting a country's balance of payments needs as of the end-date of the period specified. This category includes not only foreign currency and gold, but also a country's holdings of Special Drawing Rights in the International Monetary Fund, and its reserve position in the Fund. Reserves of foreign exchange and gold field listing
$38.77 billion (31 December 2017 est.)
$25.84 billion (31 December 2016 est.)
country comparison to the world: 45
Debt - external: This entry gives the total public and private debt owed to nonresidents repayable in internationally accepted currencies, goods, or services. These figures are calculated on an exchange rate basis, i.e., not in purchasing power parity (PPP) terms. Debt - external field listing
$40.96 billion (31 December 2017 est.)
$31.41 billion (31 December 2016 est.)
country comparison to the world: 73
Exchange rates: This entry provides the average annual price of a country's monetary unit for the time period specified, expressed in units of local currency per US dollar, as determined by international market forces or by official fiat. The International Organization for Standardization (ISO) 4217 alphabetic currency code for the national medium of exchange is presented in parenthesis. Closing daily exchange rates are not presented in The World Factbook, but are used to convert stock values - e.g., the . . . more Exchange rates field listing
nairas (NGN) per US dollar -
323.5 (2017 est.)
253 (2016 est.)
253 (2015 est.)
192.73 (2014 est.)
158.55 (2013 est.)
Energy :: Nigeria
Electricity access: This entry provides information on access to electricity. Electrification data – collected from industry reports, national surveys, and international sources – consists of four subfields. Population without electricity provides an estimate of the number of citizens that do not have access to electricity. Electrification – total population is the percent of a country’s total population with access to electricity, electrification – urban areas is the percent of a country’s urban population w . . . more Electricity access field listing
population without electricity: 77 million (2017)
electrification - total population: 59.3% (2016)
electrification - urban areas: 86% (2016)
electrification - rural areas: 41.1% (2016)
Electricity - production: This entry is the annual electricity generated expressed in kilowatt-hours. The discrepancy between the amount of electricity generated and/or imported and the amount consumed and/or exported is accounted for as loss in transmission and distribution. Electricity - production field listing
29.35 billion kWh (2016 est.)
country comparison to the world: 67
Electricity - consumption: This entry consists of total electricity generated annually plus imports and minus exports, expressed in kilowatt-hours. The discrepancy between the amount of electricity generated and/or imported and the amount consumed and/or exported is accounted for as loss in transmission and distribution. Electricity - consumption field listing
24.72 billion kWh (2016 est.)
country comparison to the world: 69
Electricity - exports: This entry is the total exported electricity in kilowatt-hours. Electricity - exports field listing
0 kWh (2016 est.)
country comparison to the world: 178
Electricity - imports: This entry is the total imported electricity in kilowatt-hours. Electricity - imports field listing
0 kWh (2016 est.)
country comparison to the world: 180
Electricity - installed generating capacity: This entry is the total capacity of currently installed generators, expressed in kilowatts (kW), to produce electricity. A 10-kilowatt (kW) generator will produce 10 kilowatt hours (kWh) of electricity, if it runs continuously for one hour. Electricity - installed generating capacity field listing
10.52 million kW (2016 est.)
country comparison to the world: 58
Electricity - from fossil fuels: This entry measures the capacity of plants that generate electricity by burning fossil fuels (such as coal, petroleum products, and natural gas), expressed as a share of the country's total generating capacity. Electricity - from fossil fuels field listing
80% of total installed capacity (2016 est.)
country comparison to the world: 83
Electricity - from nuclear fuels: This entry measures the capacity of plants that generate electricity through radioactive decay of nuclear fuel, expressed as a share of the country's total generating capacity. Electricity - from nuclear fuels field listing
0% of total installed capacity (2017 est.)
country comparison to the world: 157
Electricity - from hydroelectric plants: This entry measures the capacity of plants that generate electricity by water-driven turbines, expressed as a share of the country's total generating capacity. Electricity - from hydroelectric plants field listing
19% of total installed capacity (2017 est.)
country comparison to the world: 91
Electricity - from other renewable sources: This entry measures the capacity of plants that generate electricity by using renewable energy sources other than hydroelectric (including, for example, wind, waves, solar, and geothermal), expressed as a share of the country's total generating capacity. Electricity - from other renewable sources field listing
0% of total installed capacity (2017 est.)
country comparison to the world: 203
Crude oil - production: This entry is the total amount of crude oil produced, in barrels per day (bbl/day). Crude oil - production field listing
1.989 million bbl/day (2018 est.)
country comparison to the world: 11
Crude oil - exports: This entry is the total amount of crude oil exported, in barrels per day (bbl/day). Crude oil - exports field listing
2.096 million bbl/day (2015 est.)
country comparison to the world: 6
Crude oil - imports: This entry is the total amount of crude oil imported, in barrels per day (bbl/day). Crude oil - imports field listing
0 bbl/day (2015 est.)
country comparison to the world: 177
Crude oil - proved reserves: This entry is the stock of proved reserves of crude oil, in barrels (bbl). Proved reserves are those quantities of petroleum which, by analysis of geological and engineering data, can be estimated with a high degree of confidence to be commercially recoverable from a given date forward, from known reservoirs and under current economic conditions. Crude oil - proved reserves field listing
37.45 billion bbl (1 January 2018 est.)
country comparison to the world: 10
Refined petroleum products - production: This entry is the country's total output of refined petroleum products, in barrels per day (bbl/day). The discrepancy between the amount of refined petroleum products produced and/or imported and the amount consumed and/or exported is due to the omission of stock changes, refinery gains, and other complicating factors. Refined petroleum products - production field listing
35,010 bbl/day (2017 est.)
country comparison to the world: 83
Refined petroleum products - consumption: This entry is the country's total consumption of refined petroleum products, in barrels per day (bbl/day). The discrepancy between the amount of refined petroleum products produced and/or imported and the amount consumed and/or exported is due to the omission of stock changes, refinery gains, and other complicating factors. Refined petroleum products - consumption field listing
325,000 bbl/day (2016 est.)
country comparison to the world: 41
Refined petroleum products - exports: This entry is the country's total exports of refined petroleum products, in barrels per day (bbl/day). Refined petroleum products - exports field listing
2,332 bbl/day (2015 est.)
country comparison to the world: 102
Refined petroleum products - imports: This entry is the country's total imports of refined petroleum products, in barrels per day (bbl/day). Refined petroleum products - imports field listing
223,400 bbl/day (2015 est.)
country comparison to the world: 31
Natural gas - production: This entry is the total natural gas produced in cubic meters (cu m). The discrepancy between the amount of natural gas produced and/or imported and the amount consumed and/or exported is due to the omission of stock changes and other complicating factors. Natural gas - production field listing
44.48 billion cu m (2017 est.)
country comparison to the world: 18
Natural gas - consumption: This entry is the total natural gas consumed in cubic meters (cu m). The discrepancy between the amount of natural gas produced and/or imported and the amount consumed and/or exported is due to the omission of stock changes and other complicating factors. Natural gas - consumption field listing
17.24 billion cu m (2017 est.)
country comparison to the world: 41
Natural gas - exports: This entry is the total natural gas exported in cubic meters (cu m). Natural gas - exports field listing
27.21 billion cu m (2017 est.)
country comparison to the world: 13
Natural gas - imports: This entry is the total natural gas imported in cubic meters (cu m). Natural gas - imports field listing
0 cu m (2017 est.)
country comparison to the world: 169
Natural gas - proved reserves: This entry is the stock of proved reserves of natural gas in cubic meters (cu m). Proved reserves are those quantities of natural gas, which, by analysis of geological and engineering data, can be estimated with a high degree of confidence to be commercially recoverable from a given date forward, from known reservoirs and under current economic conditions. Natural gas - proved reserves field listing
5.475 trillion cu m (1 January 2018 est.)
country comparison to the world: 8
Carbon dioxide emissions from consumption of energy: This entry is the total amount of carbon dioxide, measured in metric tons, released by burning fossil fuels in the process of producing and consuming energy. Carbon dioxide emissions from consumption of energy field listing
104 million Mt (2017 est.)
country comparison to the world: 42
Communications :: Nigeria
Telephones - fixed lines: This entry gives the total number of fixed telephone lines in use, as well as the number of subscriptions per 100 inhabitants. Telephones - fixed lines field listing
total subscriptions: 140,491
subscriptions per 100 inhabitants: less than 1 (2018 est.)
country comparison to the world: 130
Telephones - mobile cellular: This entry gives the total number of mobile cellular telephone subscribers, as well as the number of subscriptions per 100 inhabitants. Note that because of the ubiquity of mobile phone use in developed countries, the number of subscriptions per 100 inhabitants can exceed 100. Telephones - mobile cellular field listing
total subscriptions: 172,730,603
subscriptions per 100 inhabitants: 85 (2018 est.)
country comparison to the world: 8
Telecommunication systems: This entry includes a brief general assessment of the telecommunications system with details on the domestic and international components. The following terms and abbreviations are used throughout the entry: Arabsat - Arab Satellite Communications Organization (Riyadh, Saudi Arabia). Autodin - Automatic Digital Network (US Department of Defense). CB - citizen's band mobile radio communications. Cellular telephone system - the telephones in this system are radio transceivers, with each inst . . . more Telecommunication systems field listing
general assessment: one of the larger telecom markets in Africa; most Internet connections are via mobile networks; foreign investment presence, particularly China; market competition; LTE-A technologies available but GSM technology dominate; mobile penetration rate of 123% and 173 million subscribers; unified licensing regime; government committed to expanding broadband penetration; in Q1 2018, the Nigerian Communications Commission approved seven licenses to telecom companies to deploy fiber optic cable in the six geopolitical zones and Lagos; operators invest in base stations to take care of network congestion (2020)
domestic: fixed-line subscribership remains less than 1 per 100 persons; mobile-cellular services growing rapidly, in part responding to the shortcomings of the fixed-line network; multiple cellular providers operate nationally with subscribership base over 85 per 100 persons (2018)
international: country code - 234; landing point for the SAT-3/WASC, NCSCS, MainOne, Glo-1 & 2, ACE, and Equiano fiber-optic submarine cable that provides connectivity to Europe and South and West Africa; satellite earth stations - 3 Intelsat (2 Atlantic Ocean and 1 Indian Ocean) (2019)
the COVID-19 outbreak is negatively impacting telecommunications production and supply chains globally; consumer spending on telecom devices and services has also slowed due to the pandemic's effect on economies worldwide; overall progress towards improvements in all facets of the telecom industry - mobile, fixed-line, broadband, submarine cable and satellite - has moderated
Broadcast media: This entry provides information on the approximate number of public and private TV and radio stations in a country, as well as basic information on the availability of satellite and cable TV services. Broadcast media field listing
nearly 70 federal government-controlled national and regional TV stations; all 36 states operate TV stations; several private TV stations operational; cable and satellite TV subscription services are available; network of federal government-controlled national, regional, and state radio stations; roughly 40 state government-owned radio stations typically carry their own programs except for news broadcasts; about 20 private radio stations; transmissions of international broadcasters are available; digital broadcasting migration process completed in three states in 2018 (2019)
Internet country code: This entry includes the two-letter codes maintained by the International Organization for Standardization (ISO) in the ISO 3166 Alpha-2 list and used by the Internet Assigned Numbers Authority (IANA) to establish country-coded top-level domains (ccTLDs). Internet country code field listing
.ng
Internet users: This entry gives the total number of individuals within a country who can access the Internet at home, via any device type (computer or mobile) and connection. The percent of population with Internet access (i.e., the penetration rate) helps gauge how widespread Internet use is within a country. Statistics vary from country to country and may include users who access the Internet at least several times a week to those who access it only once within a period of several months. Internet users field listing
total: 47,759,904
percent of population: 25.7% (July 2016 est.)
country comparison to the world: 15
Broadband - fixed subscriptions: This entry gives the total number of fixed-broadband subscriptions, as well as the number of subscriptions per 100 inhabitants. Fixed broadband is a physical wired connection to the Internet (e.g., coaxial cable, optical fiber) at speeds equal to or greater than 256 kilobits/second (256 kbit/s). Broadband - fixed subscriptions field listing
total: 73,965
subscriptions per 100 inhabitants: less than 1 (2018 est.)
country comparison to the world: 126
Military and Security :: Nigeria
Military expenditures: This entry gives spending on defense programs for the most recent year available as a percent of gross domestic product (GDP); the GDP is calculated on an exchange rate basis, i.e., not in terms of purchasing power parity (PPP). For countries with no military forces, this figure can include expenditures on public security and police. Military expenditures field listing
0.5% of GDP (2019)
0.51% of GDP (2018)
0.43% of GDP (2017)
0.43% of GDP (2016)
0.42% of GDP (2015)
country comparison to the world: 149
Military and security forces: This entry lists the military and security forces subordinate to defense ministries or the equivalent (typically ground, naval, air, and marine forces), as well as those belonging to interior ministries or the equivalent (typically gendarmeries, border/coast guards, paramilitary police, and other internal security forces). Military and security forces field listing
Nigerian Armed Forces: Army, Navy (includes Coast Guard), Air Force; Ministry of Interior: Nigeria Security and Civil Defence Corps (NSCDC, a paramilitary agency commissioned to assist the military in the management of threats to internal security, including attacks and natural disasters) (2019)
Military service age and obligation: This entry gives the required ages for voluntary or conscript military service and the length of service obligation. Military service age and obligation field listing
18 years of age for voluntary military service; no conscription (2012)
Maritime threats: This entry describes the threat of piracy, as defined in Article 101, UN Convention on the Law of the Sea (UNCLOS), or armed robbery against ships, as defined in Resolution A. 1025 (26) adopted on 2 December 2009 at the 26th Assembly Session of the International Maritime Organization. The entry includes the number of ships on the high seas or in territorial waters that were boarded or attacked by pirates, and the number of crewmen abducted or killed, as compiled by the International Mariti . . . more Maritime threats field listing
the International Maritime Bureau reports the territorial and offshore waters in the Niger Delta and Gulf of Guinea as very high risk for piracy and armed robbery of ships; in 2018, 48 commercial vessels were boarded or attacked compared with 33 attacks in 2017; in 2018, 29 ships were boarded eight of which were underway, 12 were fired upon, and 78 crew members were abducted; Nigerian pirates have extended the range of their attacks to as far away as Cote d'Ivoire and as far as 170 nm offshore; the Maritime Administration of the US Department of Transportation has issued a Maritime Advisory (2019-010-Gulf of Guinea-Piracy/Armed Robbery/Kidnapping for Ransom) effective 19 July 2019, which states in part "Piracy, armed robbery, and kidnapping for ransom (KFR) continue to serve as significant threats to U.S. flagged vessels transiting or operating in the Gulf of Guinea (GoG). ...According to the Office of Naval Intelligence’s “Weekly Piracy Reports” 72 reported incidents of piracy and armed robbery at sea occurred in the GoG region this year as of July 9, 2019. Attacks, kidnappings for ransom (KFR), and boardings to steal valuables from the ships and crews are the most common types of incidents with approximately 75 percent of all incidents taking place off Nigeria. During the first six months of 2019, there were 15 kidnapping and 3 hijackings in the GoG."
Transportation :: Nigeria
National air transport system: This entry includes four subfields describing the air transport system of a given country in terms of both structure and performance. The first subfield, number of registered air carriers, indicates the total number of air carriers registered with the country’s national aviation authority and issued an air operator certificate as required by the Convention on International Civil Aviation. The second subfield, inventory of registered aircraft operated by air carriers, lists the total number . . . more National air transport system field listing
number of registered air carriers: 16 (2015)
inventory of registered aircraft operated by air carriers: 73 (2015)
annual passenger traffic on registered air carriers: 3,223,459 (2015)
annual freight traffic on registered air carriers: 22,400,657 mt-km (2015)
Civil aircraft registration country code prefix: This entry provides the one- or two-character alphanumeric code indicating the nationality of civil aircraft. Article 20 of the Convention on International Civil Aviation (Chicago Convention), signed in 1944, requires that all aircraft engaged in international air navigation bear appropriate nationality marks. The aircraft registration number consists of two parts: a prefix consisting of a one- or two-character alphanumeric code indicating nationality and a registration suffix of one to fi . . . more Civil aircraft registration country code prefix field listing
5N (2016)
Airports: This entry gives the total number of airports or airfields recognizable from the air. The runway(s) may be paved (concrete or asphalt surfaces) or unpaved (grass, earth, sand, or gravel surfaces) and may include closed or abandoned installations. Airports or airfields that are no longer recognizable (overgrown, no facilities, etc.) are not included. Note that not all airports have accommodations for refueling, maintenance, or air traffic control. Airports field listing
54 (2013)
country comparison to the world: 87
Airports - with paved runways: This entry gives the total number of airports with paved runways (concrete or asphalt surfaces) by length. For airports with more than one runway, only the longest runway is included according to the following five groups - (1) over 3,047 m (over 10,000 ft), (2) 2,438 to 3,047 m (8,000 to 10,000 ft), (3) 1,524 to 2,437 m (5,000 to 8,000 ft), (4) 914 to 1,523 m (3,000 to 5,000 ft), and (5) under 914 m (under 3,000 ft). Only airports with usable runways are included in this listing. Not all . . . more Airports - with paved runways field listing
total: 40 (2017)
over 3,047 m: 10 (2017)
2,438 to 3,047 m: 12 (2017)
1,524 to 2,437 m: 9 (2017)
914 to 1,523 m: 6 (2017)
under 914 m: 3 (2017)
Airports - with unpaved runways: This entry gives the total number of airports with unpaved runways (grass, dirt, sand, or gravel surfaces) by length. For airports with more than one runway, only the longest runway is included according to the following five groups - (1) over 3,047 m (over 10,000 ft), (2) 2,438 to 3,047 m (8,000 to 10,000 ft), (3) 1,524 to 2,437 m (5,000 to 8,000 ft), (4) 914 to 1,523 m (3,000 to 5,000 ft), and (5) under 914 m (under 3,000 ft). Only airports with usable runways are included in this listin . . . more Airports - with unpaved runways field listing
total: 14 (2013)
1,524 to 2,437 m: 2 (2013)
914 to 1,523 m: 9 (2013)
under 914 m: 3 (2013)
Heliports: This entry gives the total number of heliports with hard-surface runways, helipads, or landing areas that support routine sustained helicopter operations exclusively and have support facilities including one or more of the following facilities: lighting, fuel, passenger handling, or maintenance. It includes former airports used exclusively for helicopter operations but excludes heliports limited to day operations and natural clearings that could support helicopter landings and takeoffs. Heliports field listing
5 (2013)
Pipelines: This entry gives the lengths and types of pipelines for transporting products like natural gas, crude oil, or petroleum products. Pipelines field listing
124 km condensate, 4045 km gas, 164 km liquid petroleum gas, 4441 km oil, 3940 km refined products (2013)
Railways: This entry states the total route length of the railway network and of its component parts by gauge, which is the measure of the distance between the inner sides of the load-bearing rails. The four typical types of gauges are: broad, standard, narrow, and dual. Other gauges are listed under note. Some 60% of the world's railways use the standard gauge of 1.4 m (4.7 ft). Gauges vary by country and sometimes within countries. The choice of gauge during initial construction was mainly in resp . . . more Railways field listing
total: 3,798 km (2014)
standard gauge: 293 km 1.435-m gauge (2014)
narrow gauge: 3,505 km 1.067-m gauge (2014)
note: as of the end of 2018, there were only six operational locomotives in Nigeria primarily used for passenger service; the majority of the rail lines are in a severe state of disrepair and need to be replaced
country comparison to the world: 54
Roadways: This entry gives the total length of the road network and includes the length of the paved and unpaved portions. Roadways field listing
total: 195,000 km (2017)
paved: 60,000 km (2017)
unpaved: 135,000 km (2017)
country comparison to the world: 29
Waterways: This entry gives the total length of navigable rivers, canals, and other inland bodies of water. Waterways field listing
8,600 km (Niger and Benue Rivers and smaller rivers and creeks) (2011)
country comparison to the world: 15
Merchant marine: This entry provides the total and the number of each type of privately or publicly owned commercial ship for each country; military ships are not included; the five ships by type include: bulk carrier - for cargo such as coal, grain, cement, ores, and gravel; container ship - for loads in truck-size containers, a transportation system called containerization; general cargo - also referred to as break-bulk containers - for a wide variety of packaged merchandise, such as textiles, furniture . . . more Merchant marine field listing
total: 677
by type: general cargo 15, oil tanker 105, other 557 (2019)
country comparison to the world: 33
Ports and terminals: This entry lists major ports and terminals primarily on the basis of the amount of cargo tonnage shipped through the facilities on an annual basis. In some instances, the number of containers handled or ship visits were also considered. Most ports service multiple classes of vessels including bulk carriers (dry and liquid), break bulk cargoes (goods loaded individually in bags, boxes, crates, or drums; sometimes palletized), containers, roll-on/roll-off, and passenger ships. The listing le . . . more Ports and terminals field listing
major seaport(s): Bonny Inshore Terminal, Calabar, Lagos
LNG terminal(s) (export): Bonny Island
Terrorism :: Nigeria
Terrorist groups - home based: This entry provides information on the US State Department's designated Foreign Terrorist Organizations headquartered in a specific country, which may or may not be a group's country of origin. Details on each organization's aim(s) and area(s) of operation are provided. Terrorist groups - home based field listing
Boko Haram: aim(s): replace the Nigerian Government with an Islamic state under strict sharia and, ultimately, establish an Islamic caliphate across Africa; avenge military offenses against the group and destroy any political or social activity associated with Western society; conducts attacks against primarily civilian and regional military targets
area(s) of operation: headquartered in the northeast
note: since 2009, fighters have killed tens of thousands of Nigerians during hundreds of attacks and disrupted trade and farming in the northeast, causing a risk of famine and displacing millions of people; violently opposes any political or social activity associated with Western society, including voting, attending secular schools, and wearing Western dress (2018)
Islamic State of Iraq and ash-Sham (ISIS)-West Africa: aim(s): implement ISIS's strict interpretation of Sharia; replace the Nigerian Government with an Islamic state
area(s) of operation: based primarily in the north along the border with Niger, with its largest presence in the northeast and the Lake Chad region; targets primarily regional military installations and civilians (2018)
Transnational Issues :: Nigeria
Disputes - international: This entry includes a wide variety of situations that range from traditional bilateral boundary disputes to unilateral claims of one sort or another. Information regarding disputes over international terrestrial and maritime boundaries has been reviewed by the US Department of State. References to other situations involving borders or frontiers may also be included, such as resource disputes, geopolitical questions, or irredentist issues; however, inclusion does not necessarily constitute . . . more Disputes - international field listing
Joint Border Commission with Cameroon reviewed 2002 ICJ ruling on the entire boundary and bilaterally resolved differences, including June 2006 Greentree Agreement that immediately cedes sovereignty of the Bakassi Peninsula to Cameroon with a phaseout of Nigerian control within two years while resolving patriation issues; the ICJ ruled on an equidistance settlement of Cameroon-Equatorial Guinea-Nigeria maritime boundary in the Gulf of Guinea, but imprecisely defined coordinates in the ICJ decision and a sovereignty dispute between Equatorial Guinea and Cameroon over an island at the mouth of the Ntem River all contribute to the delay in implementation; only Nigeria and Cameroon have heeded the Lake Chad Commission's admonition to ratify the delimitation treaty which also includes the Chad-Niger and Niger-Nigeria boundaries; location of Benin-Niger-Nigeria tripoint is unresolved
Refugees and internally displaced persons: This entry includes those persons residing in a country as refugees, internally displaced persons (IDPs), or stateless persons. Each country's refugee entry includes only countries of origin that are the source of refugee populations of 5,000 or more. The definition of a refugee according to a UN Convention is "a person who is outside his/her country of nationality or habitual residence; has a well-founded fear of persecution because of his/her race, religion, nationality, membership in a . . . more Refugees and internally displaced persons field listing
refugees (country of origin): 44,524 (Cameroon) (2019)
IDPs: 3,214,506 (northeast Nigeria; Boko Haram attacks and counterinsurgency efforts in northern Nigeria; communal violence between Christians and Muslims in the middle belt region, political violence; flooding; forced evictions; cattle rustling; competition for resources) (2020)
Illicit drugs: This entry gives information on the five categories of illicit drugs - narcotics, stimulants, depressants (sedatives), hallucinogens, and cannabis. These categories include many drugs legally produced and prescribed by doctors as well as those illegally produced and sold outside of medical channels. Cannabis (Cannabis sativa) is the common hemp plant, which provides hallucinogens with some sedative properties, and includes marijuana (pot, Acapulco gold, grass, reefer), tetrahydroca . . . more Illicit drugs field listing
a transit point for heroin and cocaine intended for European, East Asian, and North American markets; consumer of amphetamines; safe haven for Nigerian narcotraffickers operating worldwide; major money-laundering center; massive corruption and criminal activity; Nigeria has improved some anti-money-laundering controls, resulting in its removal from the Financial Action Task Force's (FATF's) Noncooperative Countries and Territories List in June 2006; Nigeria's anti-money-laundering regime continues to be monitored by FATF