
.
Chile

The mystery of Easter island, Mrs. Scoresby Routledge
The Gold Diggings of Cape Horn , John R. Spears
Journeys and Experiences in Argentina, Paraguay, and Chile, by Henry Stephens
Chile (South America)
Introduction :: Chile
Background: This entry usually highlights major historic events and current issues and may include a statement about one or two key future trends. Background field listing
Prior to the arrival of the Spanish in the 16th century, the Inca ruled northern Chile for nearly a century while an indigenous people, the Mapuche, inhabited central and southern Chile. Although Chile declared its independence in 1810, it did not achieve decisive victory over the Spanish until 1818. In the War of the Pacific (1879-83), Chile defeated Peru and Bolivia to win its present northern regions. In the 1880s, the Chilean central government gained control over the central and southern regions inhabited by the Mapuche. After a series of elected governments, the three-year-old Marxist government of Salvador ALLENDE was overthrown in 1973 by a military coup led by General Augusto PINOCHET, who ruled until a democratically-elected president was inaugurated in 1990. Economic reforms, maintained consistently since the 1980s, contributed to steady growth, reduced poverty rates by over half, and helped secure the country's commitment to democratic and representative government. Chile has increasingly assumed regional and international leadership roles befitting its status as a stable, democratic nation.
Geography ::Chile
Location: This entry identifies the country's regional location, neighboring countries, and adjacent bodies of water. Location field listing
Southern South America, bordering the South Pacific Ocean, between Argentina and Peru
Geographic coordinates: This entry includes rounded latitude and longitude figures for the centroid or center point of a country expressed in degrees and minutes; it is based on the locations provided in the Geographic Names Server (GNS), maintained by the National Geospatial-Intelligence Agency on behalf of the US Board on Geographic Names. Geographic coordinates field listing
30 00 S, 71 00 W
Map references: This entry includes the name of the Factbook reference map on which a country may be found. Note that boundary representations on these maps are not necessarily authoritative. The entry on Geographic coordinates may be helpful in finding some smaller countries. Map references field listing
South America
Area: This entry includes three subfields. Total area is the sum of all land and water areas delimited by international boundaries and/or coastlines. Land area is the aggregate of all surfaces delimited by international boundaries and/or coastlines, excluding inland water bodies (lakes, reservoirs, rivers). Water area is the sum of the surfaces of all inland water bodies, such as lakes, reservoirs, or rivers, as delimited by international boundaries and/or coastlines. Area field listing
total: 756,102 sq km
land: 743,812 sq km
water: 12,290 sq km
note: includes Easter Island (Isla de Pascua) and Isla Sala y Gomez
country comparison to the world: 39
Area - comparative: This entry provides an area comparison based on total area equivalents. Most entities are compared with the entire US or one of the 50 states based on area measurements (1990 revised) provided by the US Bureau of the Census. The smaller entities are compared with Washington, DC (178 sq km, 69 sq mi) or The Mall in Washington, DC (0.59 sq km, 0.23 sq mi, 146 acres). Area - comparative field listing
slightly smaller than twice the size of Montana
Area comparison map: Area comparison map
Land boundaries: This entry contains the total length of all land boundaries and the individual lengths for each of the contiguous border countries. When available, official lengths published by national statistical agencies are used. Because surveying methods may differ, country border lengths reported by contiguous countries may differ. Land boundaries field listing
total: 7,801 km
border countries (3): Argentina 6691 km, Bolivia 942 km, Peru 168 km
Coastline: This entry gives the total length of the boundary between the land area (including islands) and the sea. Coastline field listing
6,435 km
Maritime claims: This entry includes the following claims, the definitions of which are excerpted from the United Nations Convention on the Law of the Sea (UNCLOS), which alone contains the full and definitive descriptions: territorial sea - the sovereignty of a coastal state extends beyond its land territory and internal waters to an adjacent belt of sea, described as the territorial sea in the UNCLOS (Part II); this sovereignty extends to the air space over the territorial sea as well as its underlying s . . . more Maritime claims field listing
territorial sea: 12 nm
exclusive economic zone: 200 nm
contiguous zone: 24 nm
continental shelf: 200/350 nm
Climate: This entry includes a brief description of typical weather regimes throughout the year; in the Word entry only, it includes four subfields that describe climate extremes:ten driest places on earth (average annual precipitation) describes the annual average precipitation measured in both millimeters and inches for selected countries with climate extremes. ten wettest places on earth (average annual precipitation) describes the annual average precipitation measured in both millimeters and i . . . more Climate field listing
temperate; desert in north; Mediterranean in central region; cool and damp in south
Terrain: This entry contains a brief description of the topography. Terrain field listing
low coastal mountains, fertile central valley, rugged Andes in east
Elevation: This entry includes the mean elevation and elevation extremes, lowest point and highest point. Elevation field listing
mean elevation: 1,871 m
lowest point: Pacific Ocean 0 m
highest point: Nevado Ojos del Salado 6,880 m
Natural resources: This entry lists a country's mineral, petroleum, hydropower, and other resources of commercial importance, such as rare earth elements (REEs). In general, products appear only if they make a significant contribution to the economy, or are likely to do so in the future. Natural resources field listing
copper, timber, iron ore, nitrates, precious metals, molybdenum, hydropower
Land use: This entry contains the percentage shares of total land area for three different types of land use: agricultural land, forest, and other; agricultural land is further divided into arable land - land cultivated for crops like wheat, maize, and rice that are replanted after each harvest, permanent crops - land cultivated for crops like citrus, coffee, and rubber that are not replanted after each harvest, and includes land under flowering shrubs, fruit trees, nut trees, and vines, and permane . . . more Land use field listing
agricultural land: 21.1% (2011 est.)
arable land: 1.7% (2011 est.) / permanent crops: 0.6% (2011 est.) / permanent pasture: 18.8% (2011 est.)
forest: 21.9% (2011 est.)
other: 57% (2011 est.)
Irrigated land: This entry gives the number of square kilometers of land area that is artificially supplied with water. Irrigated land field listing
11,100 sq km (2012)
Population distribution: This entry provides a summary description of the population dispersion within a country. While it may suggest population density, it does not provide density figures. Population distribution field listing
90% of the population is located in the middle third of the country around the capital of Santiago; the far north (anchored by the Atacama Desert) and the extreme south are relatively underpopulated
Natural hazards: This entry lists potential natural disasters. For countries where volcanic activity is common, a volcanism subfield highlights historically active volcanoes. Natural hazards field listing
severe earthquakes; active volcanism; tsunamis
volcanism: significant volcanic activity due to more than three-dozen active volcanoes along the Andes Mountains; Lascar (5,592 m), which last erupted in 2007, is the most active volcano in the northern Chilean Andes; Llaima (3,125 m) in central Chile, which last erupted in 2009, is another of the country's most active; Chaiten's 2008 eruption forced major evacuations; other notable historically active volcanoes include Cerro Hudson, Calbuco, Copahue, Guallatiri, Llullaillaco, Nevados de Chillan, Puyehue, San Pedro, and Villarrica; see note 2 under "Geography - note"
Environment - current issues: This entry lists the most pressing and important environmental problems. The following terms and abbreviations are used throughout the entry: Acidification - the lowering of soil and water pH due to acid precipitation and deposition usually through precipitation; this process disrupts ecosystem nutrient flows and may kill freshwater fish and plants dependent on more neutral or alkaline conditions (see acid rain). Acid rain - characterized as containing harmful levels of sulfur dioxi . . . more Environment - current issues field listing
air pollution from industrial and vehicle emissions; water pollution from raw sewage; noise pollution; improper garbage disposal; soil degradation; widespread deforestation and mining threaten the environment; wildlife conservation
Environment - international agreements: This entry separates country participation in international environmental agreements into two levels - party to and signed, but not ratified. Agreements are listed in alphabetical order by the abbreviated form of the full name. Environment - international agreements field listing
party to: Antarctic-Environmental Protocol, Antarctic-Marine Living Resources, Antarctic Seals, Antarctic Treaty, Biodiversity, Climate Change, Climate Change-Kyoto Protocol, Desertification, Endangered Species, Environmental Modification, Hazardous Wastes, Law of the Sea, Marine Dumping, Ozone Layer Protection, Ship Pollution, Wetlands, Whaling
signed, but not ratified: none of the selected agreements
Geography - note: This entry includes miscellaneous geographic information of significance not included elsewhere. Geography - note field listing
note 1: the longest north-south trending country in the world, extending across 39 degrees of latitude; strategic location relative to sea lanes between the Atlantic and Pacific Oceans (Strait of Magellan, Beagle Channel, Drake Passage)
note 2: Chile is one of the countries along the Ring of Fire, a belt of active volcanoes and earthquake epicenters bordering the Pacific Ocean; up to 90% of the world's earthquakes and some 75% of the world's volcanoes occur within the Ring of Fire
note 3: the Atacama Desert - the driest desert in the world - spreads across the northern part of the country; Ojos del Salado (6,893 m) in the Atacama Desert is the highest active volcano in the world, Chile's tallest mountain, and the second highest in the Western Hemisphere and the Southern Hemisphere - its small crater lake (at 6,390 m) is the world's highest lake
People and Society :: Chile
Population: This entry gives an estimate from the US Bureau of the Census based on statistics from population censuses, vital statistics registration systems, or sample surveys pertaining to the recent past and on assumptions about future trends. The total population presents one overall measure of the potential impact of the country on the world and within its region. Note: Starting with the 1993 Factbook, demographic estimates for some countries (mostly African) have explicitly taken into account t . . . more Population field listing
18,186,770 (July 2020 est.)
country comparison to the world: 65
Nationality: This entry provides the identifying terms for citizens - noun and adjective. Nationality field listing
noun: Chilean(s)
adjective: Chilean
Ethnic groups: This entry provides an ordered listing of ethnic groups starting with the largest and normally includes the percent of total population. Ethnic groups field listing
white and non-indigenous 88.9%, Mapuche 9.1%, Aymara 0.7%, other indigenous groups 1% (includes Rapa Nui, Likan Antai, Quechua, Colla, Diaguita, Kawesqar, Yagan or Yamana), unspecified 0.3% (2012 est.)
Languages: This entry provides a listing of languages spoken in each country and specifies any that are official national or regional languages. When data is available, the languages spoken in each country are broken down according to the percent of the total population speaking each language as a first language. For those countries without available data, languages are listed in rank order based on prevalence, starting with the most-spoken language. Languages field listing
Spanish 99.5% (official), English 10.2%, indigenous 1% (includes Mapudungun, Aymara, Quechua, Rapa Nui), other 2.3%, unspecified 0.2% (2012 est.)
note: shares sum to more than 100% because some respondents gave more than one answer on the census
Religions: This entry is an ordered listing of religions by adherents starting with the largest group and sometimes includes the percent of total population. The core characteristics and beliefs of the world's major religions are described below. Baha'i - Founded by Mirza Husayn-Ali (known as Baha'u'llah) in Iran in 1852, Baha'i faith emphasizes monotheism and believes in one eternal transcendent God. Its guiding focus is to encourage the unity of all peoples on the earth so that justice and peace m . . . more Religions field listing
Roman Catholic 66.7%, Evangelical or Protestant 16.4%, Jehovah's Witness 1%, other 3.4%, none 11.5%, unspecified 1.1% (2012 est.)
Demographic profile: This entry describes a country’s key demographic features and trends and how they vary among regional, ethnic, and socioeconomic sub-populations. Some of the topics addressed are population age structure, fertility, health, mortality, poverty, education, and migration. Demographic profile field listing
Chile is in the advanced stages of demographic transition and is becoming an aging society - with fertility below replacement level, low mortality rates, and life expectancy on par with developed countries. Nevertheless, with its dependency ratio nearing its low point, Chile could benefit from its favorable age structure. It will need to keep its large working-age population productively employed, while preparing to provide for the needs of its growing proportion of elderly people, especially as women - the traditional caregivers - increasingly enter the workforce. Over the last two decades, Chile has made great strides in reducing its poverty rate, which is now lower than most Latin American countries. However, its severe income inequality ranks as the worst among members of the Organization for Economic Cooperation and Development. Unequal access to quality education perpetuates this uneven income distribution.
Chile has historically been a country of emigration but has slowly become more attractive to immigrants since transitioning to democracy in 1990 and improving its economic stability (other regional destinations have concurrently experienced deteriorating economic and political conditions). Most of Chile's small but growing foreign-born population consists of transplants from other Latin American countries, especially Peru.
Age structure: This entry provides the distribution of the population according to age. Information is included by sex and age group as follows: 0-14 years (children), 15-24 years (early working age), 25-54 years (prime working age), 55-64 years (mature working age), 65 years and over (elderly). The age structure of a population affects a nation's key socioeconomic issues. Countries with young populations (high percentage under age 15) need to invest more in schools, while countries with older population . . . more Age structure field listing
0-14 years: 19.79% (male 1,836,240/female 1,763,124)
15-24 years: 13.84% (male 1,283,710/female 1,233,238)
25-54 years: 42.58% (male 3,882,405/female 3,860,700)
55-64 years: 11.98% (male 1,034,049/female 1,145,022)
65 years and over: 11.81% (male 902,392/female 1,245,890) (2020 est.)
population pyramid: population pyramid
Dependency ratios: Dependency ratios are a measure of the age structure of a population. They relate the number of individuals that are likely to be economically "dependent" on the support of others. Dependency ratios contrast the ratio of youths (ages 0-14) and the elderly (ages 65+) to the number of those in the working-age group (ages 15-64). Changes in the dependency ratio provide an indication of potential social support requirements resulting from changes in population age structures. As fertility leve . . . more Dependency ratios field listing
total dependency ratio: 45.9
youth dependency ratio: 28.1
elderly dependency ratio: 17.9
potential support ratio: 5.6 (2020 est.)
Median age: This entry is the age that divides a population into two numerically equal groups; that is, half the people are younger than this age and half are older. It is a single index that summarizes the age distribution of a population. Currently, the median age ranges from a low of about 15 in Niger and Uganda to 40 or more in several European countries and Japan. See the entry for "Age structure" for the importance of a young versus an older age structure and, by implication, a low versus a high . . . more Median age field listing
total: 35.5 years
male: 34.3 years
female: 36.7 years (2020 est.)
country comparison to the world: 83
Population growth rate: The average annual percent change in the population, resulting from a surplus (or deficit) of births over deaths and the balance of migrants entering and leaving a country. The rate may be positive or negative. The growth rate is a factor in determining how great a burden would be imposed on a country by the changing needs of its people for infrastructure (e.g., schools, hospitals, housing, roads), resources (e.g., food, water, electricity), and jobs. Rapid population growth can be seen as . . . more Population growth rate field listing
0.71% (2020 est.)
country comparison to the world: 138
Birth rate: This entry gives the average annual number of births during a year per 1,000 persons in the population at midyear; also known as crude birth rate. The birth rate is usually the dominant factor in determining the rate of population growth. It depends on both the level of fertility and the age structure of the population. Birth rate field listing
13.1 births/1,000 population (2020 est.)
country comparison to the world: 142
Death rate: This entry gives the average annual number of deaths during a year per 1,000 population at midyear; also known as crude death rate. The death rate, while only a rough indicator of the mortality situation in a country, accurately indicates the current mortality impact on population growth. This indicator is significantly affected by age distribution, and most countries will eventually show a rise in the overall death rate, in spite of continued decline in mortality at all ages, as declining . . . more Death rate field listing
6.5 deaths/1,000 population (2020 est.)
country comparison to the world: 142
Net migration rate: This entry includes the figure for the difference between the number of persons entering and leaving a country during the year per 1,000 persons (based on midyear population). An excess of persons entering the country is referred to as net immigration (e.g., 3.56 migrants/1,000 population); an excess of persons leaving the country as net emigration (e.g., -9.26 migrants/1,000 population). The net migration rate indicates the contribution of migration to the overall level of population chan . . . more Net migration rate field listing
0.3 migrant(s)/1,000 population (2020 est.)
country comparison to the world: 70
Population distribution: This entry provides a summary description of the population dispersion within a country. While it may suggest population density, it does not provide density figures. Population distribution field listing
90% of the population is located in the middle third of the country around the capital of Santiago; the far north (anchored by the Atacama Desert) and the extreme south are relatively underpopulated
Urbanization: This entry provides two measures of the degree of urbanization of a population. The first, urban population, describes the percentage of the total population living in urban areas, as defined by the country. The second, rate of urbanization, describes the projected average rate of change of the size of the urban population over the given period of time. It is possible for a country with a 100% urban population to still display a change in the rate of urbanization (up or down). For example . . . more Urbanization field listing
urban population: 87.7% of total population (2020)
rate of urbanization: 0.87% annual rate of change (2015-20 est.)
Major urban areas - population: This entry provides the population of the capital and up to six major cities defined as urban agglomerations with populations of at least 750,000 people. An urban agglomeration is defined as comprising the city or town proper and also the suburban fringe or thickly settled territory lying outside of, but adjacent to, the boundaries of the city. For smaller countries, lacking urban centers of 750,000 or more, only the population of the capital is presented. Major urban areas - population field listing
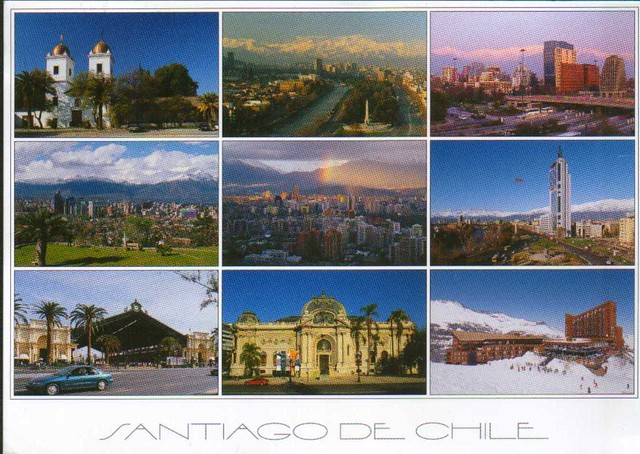
6.767 million SANTIAGO (capital), 984,000 Valparaiso, 881,000 Concepcion (2020)
Sex ratio: This entry includes the number of males for each female in five age groups - at birth, under 15 years, 15-64 years, 65 years and over, and for the total population. Sex ratio at birth has recently emerged as an indicator of certain kinds of sex discrimination in some countries. For instance, high sex ratios at birth in some Asian countries are now attributed to sex-selective abortion and infanticide due to a strong preference for sons. This will affect future marriage patterns and fertilit . . . more Sex ratio field listing
at birth: 1.04 male(s)/female
0-14 years: 1.04 male(s)/female
15-24 years: 1.04 male(s)/female
25-54 years: 1.01 male(s)/female
55-64 years: 0.9 male(s)/female
65 years and over: 0.72 male(s)/female
total population: 0.97 male(s)/female (2020 est.)
Maternal mortality rate: The maternal mortality rate (MMR) is the annual number of female deaths per 100,000 live births from any cause related to or aggravated by pregnancy or its management (excluding accidental or incidental causes). The MMR includes deaths during pregnancy, childbirth, or within 42 days of termination of pregnancy, irrespective of the duration and site of the pregnancy, for a specified year. Maternal mortality rate field listing
13 deaths/100,000 live births (2017 est.)
country comparison to the world: 138
Infant mortality rate: This entry gives the number of deaths of infants under one year old in a given year per 1,000 live births in the same year. This rate is often used as an indicator of the level of health in a country. Infant mortality rate field listing
total: 6.2 deaths/1,000 live births
male: 6.6 deaths/1,000 live births
female: 5.7 deaths/1,000 live births (2020 est.)
country comparison to the world: 164
Life expectancy at birth: This entry contains the average number of years to be lived by a group of people born in the same year, if mortality at each age remains constant in the future. Life expectancy at birth is also a measure of overall quality of life in a country and summarizes the mortality at all ages. It can also be thought of as indicating the potential return on investment in human capital and is necessary for the calculation of various actuarial measures. Life expectancy at birth field listing
total population: 79.4 years
male: 76.3 years
female: 82.5 years (2020 est.)
country comparison to the world: 53
Total fertility rate: This entry gives a figure for the average number of children that would be born per woman if all women lived to the end of their childbearing years and bore children according to a given fertility rate at each age. The total fertility rate (TFR) is a more direct measure of the level of fertility than the crude birth rate, since it refers to births per woman. This indicator shows the potential for population change in the country. A rate of two children per woman is considered the replaceme . . . more Total fertility rate field listing
1.77 children born/woman (2020 est.)
country comparison to the world: 153
Contraceptive prevalence rate: This field gives the percent of women of reproductive age (15-49) who are married or in union and are using, or whose sexual partner is using, a method of contraception according to the date of the most recent available data. The contraceptive prevalence rate is an indicator of health services, development, and women’s empowerment. It is also useful in understanding, past, present, and future fertility trends, especially in developing countries. Contraceptive prevalence rate field listing
76.3% (2015/16)
Drinking water source: This entry provides information about access to improved or unimproved drinking water sources available to segments of the population of a country. Improved drinking water - use of any of the following sources: piped water into dwelling, yard, or plot; public tap or standpipe; tubewell or borehole; protected dug well; protected spring; or rainwater collection. Unimproved drinking water - use of any of the following sources: unprotected dug well; unprotected spring; cart with small tank or . . . more Drinking water source field listing
improved: urban: 99.7% of population
rural: 93.3% of population
total: 99% of population
unimproved: urban: 0.3% of population
rural: 6.7% of population
total: 1% of population (2015 est.)
Current Health Expenditure: Current Health Expenditure (CHE) describes the share of spending on health in each country relative to the size of its economy. It includes expenditures corresponding to the final consumption of health care goods and services and excludes investment, exports, and intermediate consumption. CHE shows the importance of the health sector in the economy and indicates the priority given to health in monetary terms. Note: Current Health Expenditure replaces the former Health Expenditures field . . . more Current Health Expenditure field listing
8.5% (2016)
Physicians density: This entry gives the number of medical doctors (physicians), including generalist and specialist medical practitioners, per 1,000 of the population. Medical doctors are defined as doctors that study, diagnose, treat, and prevent illness, disease, injury, and other physical and mental impairments in humans through the application of modern medicine. They also plan, supervise, and evaluate care and treatment plans by other health care providers. The World Health Organization estimates that f . . . more Physicians density field listing
1.08 physicians/1,000 population (2016)
Hospital bed density: This entry provides the number of hospital beds per 1,000 people; it serves as a general measure of inpatient service availability. Hospital beds include inpatient beds available in public, private, general, and specialized hospitals and rehabilitation centers. In most cases, beds for both acute and chronic care are included. Because the level of inpatient services required for individual countries depends on several factors - such as demographic issues and the burden of disease - there is . . . more Hospital bed density field listing
2.2 beds/1,000 population (2013)
Sanitation facility access: This entry provides information about access to improved or unimproved sanitation facilities available to segments of the population of a country. Improved sanitation - use of any of the following facilities: flush or pour-flush to a piped sewer system, septic tank or pit latrine; ventilated improved pit (VIP) latrine; pit latrine with slab; or a composting toilet. Unimproved sanitation - use of any of the following facilities: flush or pour-flush not piped to a sewer system, septic tank . . . more Sanitation facility access field listing
improved: urban: 100% of population (2015 est.)
rural: 90.9% of population (2015 est.)
total: 99.1% of population (2015 est.)
unimproved: urban: 0% of population (2015 est.)
rural: 9.1% of population (2015 est.)
total: 0.9% of population (2015 est.)
HIV/AIDS - adult prevalence rate: This entry gives an estimate of the percentage of adults (aged 15-49) living with HIV/AIDS. The adult prevalence rate is calculated by dividing the estimated number of adults living with HIV/AIDS at yearend by the total adult population at yearend. HIV/AIDS - adult prevalence rate field listing
0.5% (2018 est.)
country comparison to the world: 69
HIV/AIDS - people living with HIV/AIDS: This entry gives an estimate of all people (adults and children) alive at yearend with HIV infection, whether or not they have developed symptoms of AIDS. HIV/AIDS - people living with HIV/AIDS field listing
71,000 (2018 est.)
country comparison to the world: 53
HIV/AIDS - deaths: This entry gives an estimate of the number of adults and children who died of AIDS during a given calendar year. HIV/AIDS - deaths field listing
<1000 (2018)
Obesity - adult prevalence rate: This entry gives the percent of a country's population considered to be obese. Obesity is defined as an adult having a Body Mass Index (BMI) greater to or equal to 30.0. BMI is calculated by taking a person's weight in kg and dividing it by the person's squared height in meters. Obesity - adult prevalence rate field listing
28% (2016)
country comparison to the world: 32
Children under the age of 5 years underweight: This entry gives the percent of children under five considered to be underweight. Underweight means weight-for-age is approximately 2 kg below for standard at age one, 3 kg below standard for ages two and three, and 4 kg below standard for ages four and five. This statistic is an indicator of the nutritional status of a community. Children who suffer from growth retardation as a result of poor diets and/or recurrent infections tend to have a greater risk of suffering illness and death. Children under the age of 5 years underweight field listing
0.5% (2014)
country comparison to the world: 125
Education expenditures: This entry provides the public expenditure on education as a percent of GDP. Education expenditures field listing
5.4% of GDP (2017)
country comparison to the world: 41
Literacy: This entry includes a definition of literacy and UNESCO's percentage estimates for populations aged 15 years and over, including total population, males, and females. There are no universal definitions and standards of literacy. Unless otherwise specified, all rates are based on the most common definition - the ability to read and write at a specified age. Detailing the standards that individual countries use to assess the ability to read and write is beyond the scope of the Factbook. Info . . . more Literacy field listing
definition: age 15 and over can read and write
total population: 96.4%
male: 96.3%
female: 96.3% (2017)
School life expectancy (primary to tertiary education): School life expectancy (SLE) is the total number of years of schooling (primary to tertiary) that a child can expect to receive, assuming that the probability of his or her being enrolled in school at any particular future age is equal to the current enrollment ratio at that age. Caution must be maintained when utilizing this indicator in international comparisons. For example, a year or grade completed in one country is not necessarily the same in terms of educational content or qualit . . . more School life expectancy (primary to tertiary education) field listing
total: 16 years
male: 16 years
female: 17 years (2016)
Unemployment, youth ages 15-24: This entry gives the percent of the total labor force ages 15-24 unemployed during a specified year. Unemployment, youth ages 15-24 field listing
total: 18.1%
male: 16.7%
female: 20.2% (2018 est.)
country comparison to the world: 73
overnment :: Chile
Country name: This entry includes all forms of the country's name approved by the US Board on Geographic Names (Italy is used as an example): conventional long form (Italian Republic), conventional short form (Italy), local long form (Repubblica Italiana), local short form (Italia), former (Kingdom of Italy), as well as the abbreviation. Also see the Terminology note. Country name field listing
conventional long form: Republic of Chile
conventional short form: Chile
local long form: Republica de Chile
local short form: Chile
etymology: derivation of the name is unclear, but it may come from the Mapuche word "chilli" meaning "limit of the earth" or from the Quechua "chiri" meaning "cold"
Government type: This entry gives the basic form of government. Definitions of the major governmental terms are as follows. (Note that for some countries more than one definition applies.): Absolute monarchy - a form of government where the monarch rules unhindered, i.e., without any laws, constitution, or legally organized opposition. Anarchy - a condition of lawlessness or political disorder brought about by the absence of governmental authority. Authoritarian - a form of government in whic . . . more Government type field listing
presidential republic
Capital: This entry gives the name of the seat of government, its geographic coordinates, the time difference relative to Coordinated Universal Time (UTC) and the time observed in Washington, DC, and, if applicable, information on daylight saving time (DST). Where appropriate, a special note has been added to highlight those countries that have multiple time zones. Capital field listing
name: Santiago; note - Valparaiso is the seat of the national legislature
geographic coordinates: 33 27 S, 70 40 W
time difference: UTC-3 (2 hours ahead of Washington, DC, during Standard Time)
daylight saving time: +1hr, begins second Sunday in August; ends second Sunday in May; note - Punta Arenas observes DST throughout the year
note: Chile has three time zones: the continental portion at UTC-3; the southern Magallanes region, which does not use daylight savings time and remains at UTC-3 for the summer months; and Easter Island at UTC-5
etymology: Santiago is named after the biblical figure Saint James (ca. A.D. 3-44), patron saint of Spain, but especially revered in Galicia; "Santiago" derives from the local Galician evolution of the Vulgar Latin "Sanctu Iacobu"; Valparaiso derives from the Spanish "Valle Paraiso" meaning "Paradise Valley"
Administrative divisions: This entry generally gives the numbers, designatory terms, and first-order administrative divisions as approved by the US Board on Geographic Names (BGN). Changes that have been reported but not yet acted on by the BGN are noted. Geographic names conform to spellings approved by the BGN with the exception of the omission of diacritical marks and special characters. Administrative divisions field listing
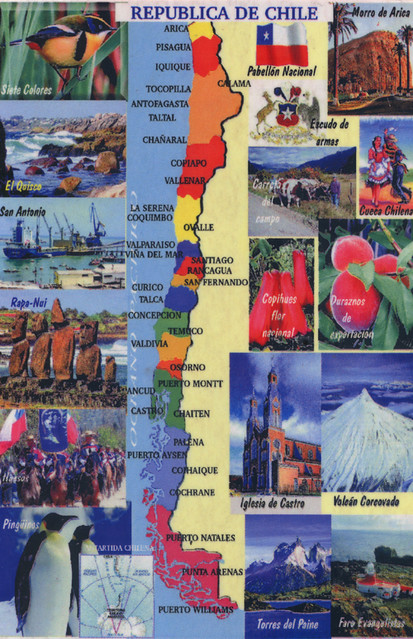
16 regions (regiones, singular - region); Aysen, Antofagasta, Araucania, Arica y Parinacota, Atacama, Biobio, Coquimbo, Libertador General Bernardo O'Higgins, Los Lagos, Los Rios, Magallanes y de la Antartica Chilena (Magallanes and Chilean Antarctica), Maule, Nuble, Region Metropolitana (Santiago), Tarapaca, Valparaiso
note: the US does not recognize any claims to Antarctica
Independence: For most countries, this entry gives the date that sovereignty was achieved and from which nation, empire, or trusteeship. For the other countries, the date given may not represent "independence" in the strict sense, but rather some significant nationhood event such as the traditional founding date or the date of unification, federation, confederation, establishment, fundamental change in the form of government, or state succession. For a number of countries, the establishment of statehood . . . more Independence field listing
18 September 1810 (from Spain)
National holiday: This entry gives the primary national day of celebration - usually independence day. National holiday field listing
Independence Day, 18 September (1810)
Constitution: This entry provides information on a country’s constitution and includes two subfields. The history subfield includes the dates of previous constitutions and the main steps and dates in formulating and implementing the latest constitution. For countries with 1-3 previous constitutions, the years are listed; for those with 4-9 previous, the entry is listed as “several previous,” and for those with 10 or more, the entry is “many previous.” The amendments subfield summarizes the process of am . . . more Constitution field listing
history: many previous; latest adopted 11 September 1980, effective 11 March 1981; note - in March 2018, days before her term ended, President BACHELET sent a proposal for a new constitution to the National Congress, but it has not been pursued by her successor
amendments: proposed by members of either house of the National Congress or by the president of the republic; passage requires at least three-fifths majority vote of the membership in both houses and approval by the president; passage of amendments to constitutional articles, such as the republican form of government, basic rights and freedoms, the Constitutional Tribunal, electoral justice, the Council of National Security, or the constitutional amendment process, requires at least two-third majority vote by both houses of Congress and approval by the president; the president can opt to hold a referendum when Congress and the president disagree on an amendment; amended many times, last in 2018; note - a referendum on a new constitution scheduled for 26 April 2020 has been postponed due to the COVID-19 pandemic (2019)
Legal system: This entry provides the description of a country's legal system. A statement on judicial review of legislative acts is also included for a number of countries. The legal systems of nearly all countries are generally modeled upon elements of five main types: civil law (including French law, the Napoleonic Code, Roman law, Roman-Dutch law, and Spanish law); common law (including United State law); customary law; mixed or pluralistic law; and religious law (including Islamic law). An addition . . . more Legal system field listing
civil law system influenced by several West European civil legal systems; judicial review of legislative acts by the Constitutional Tribunal
International law organization participation: This entry includes information on a country's acceptance of jurisdiction of the International Court of Justice (ICJ) and of the International Criminal Court (ICCt); 59 countries have accepted ICJ jurisdiction with reservations and 11 have accepted ICJ jurisdiction without reservations; 122 countries have accepted ICCt jurisdiction. Appendix B: International Organizations and Groups explains the differing mandates of the ICJ and ICCt. International law organization participation field listing
has not submitted an ICJ jurisdiction declaration; accepts ICCt jurisdiction
Citizenship: This entry provides information related to the acquisition and exercise of citizenship; it includes four subfields: citizenship by birth describes the acquisition of citizenship based on place of birth, known as Jus soli, regardless of the citizenship of parents. citizenship by descent only describes the acquisition of citizenship based on the principle of Jus sanguinis, or by descent, where at least one parent is a citizen of the state and being born within the territorial limits of the s . . . more Citizenship field listing
citizenship by birth: yes
citizenship by descent only: yes
dual citizenship recognized: yes
residency requirement for naturalization: 5 years
Suffrage: This entry gives the age at enfranchisement and whether the right to vote is universal or restricted. Suffrage field listing
18 years of age; universal
Executive branch: This entry includes five subentries: chief of state; head of government; cabinet; elections/appointments; election results. Chief of state includes the name, title, and beginning date in office of the titular leader of the country who represents the state at official and ceremonial functions but may not be involved with the day-to-day activities of the government. Head of government includes the name, title of the top executive designated to manage the executive branch of the government, a . . . more Executive branch field listing
chief of state: President Sebastian PINERA Echenique (since 11 March 2018); note - the president is both chief of state and head of government
head of government: President Sebastian PINERA Echenique (since 11 March 2018)
cabinet: Cabinet appointed by the president
elections/appointments: president directly elected by absolute majority popular vote in 2 rounds if needed for a single 4-year term; election last held on 19 November 2017 with a runoff held 17 December 2017 (next to be held in November 2021)
election results: Sebastian PINERA Echenique elected president in second round; percent of vote in first round - Sebastian PINERA Echenique (independent) 36.6%; Alejandro GUILLIER (independent) 22.7%; Beatriz SANCHEZ (independent) 20.3%; Jose Antonio KAST (independent) 7.9%; Carolina GOIC (PDC) 5.9%; Marco ENRIQUEZ-OMINAMI (PRO) 5.7%; other 0.9%; percent of vote in second round - Sebastian PINERA Echenique 54.6%, Alejandro GUILLIER 45.4%
Legislative branch: This entry has three subfields. The description subfield provides the legislative structure (unicameral – single house; bicameral – an upper and a lower house); formal name(s); number of member seats; types of constituencies or voting districts (single seat, multi-seat, nationwide); electoral voting system(s); and member term of office. The elections subfield includes the dates of the last election and next election. The election results subfield lists percent of vote by party/coalition an . . . more Legislative branch field listing
description: bicameral National Congress or Congreso Nacional consists of:
Senate or Senado (43 seats following the 2017 election; to increase to 50 in 2021); members directly elected in multi-seat constituencies by open party-list proportional representation vote to serve 8-year terms with one-half of the membership renewed every 4 years)
Chamber of Deputies or Camara de Diputados (155 seats; members directly elected in multi-seat constituencies by oen party-list proportional representation vote to serve 4-year terms)
elections:
Senate - last held on 19 November 2017 (next to be held in 2021)
Chamber of Deputies - last held on 19 November 2017 (next to be held in 2021)
election results:
Senate - percent of vote by party - NA; seats by party - New Majority Coalition (formerly known as Concertacion) 19 (PDC 6, PS 6, PPD 6, MAS 1), Let's Go Chile Coalition (formerly known as the Coalition for Change and the Alianza coalition) 15 (RN 6, UDI 8, Amplitude Party 1), independent 4; composition - men 33, women 10, percent of women 23.3%
Chamber of Deputies - percent of vote by party - NA; seats by party - New Majority 68 (PDC 21, PS 16, PPD 14, PC 6, PRSD 6, Citizen Left 1, independent 4), Coalition for Change 47 (UDI 29, RN 14, independent 3, EP 1), Liberal Party 1, independent 4; composition -men 120, women 35, percent of women 22.6%; note - total National Congress percent of women 22.7%
Judicial branch: This entry includes three subfields. The highest court(s) subfield includes the name(s) of a country's highest level court(s), the number and titles of the judges, and the types of cases heard by the court, which commonly are based on civil, criminal, administrative, and constitutional law. A number of countries have separate constitutional courts. The judge selection and term of office subfield includes the organizations and associated officials responsible for nominating and appointing j . . . more Judicial branch field listing
highest courts: Supreme Court or Corte Suprema (consists of a court president and 20 members or ministros); Constitutional Court (consists of 10 members); Elections Qualifying Court (consists of 5 members)
judge selection and term of office: Supreme Court president and judges (ministers) appointed by the president of the republic and ratified by the Senate from lists of candidates provided by the court itself; judges appointed for life with mandatory retirement at age 70; Constitutional Court members appointed - 3 by the Supreme Court, 3 by the president of the republic, 2 by the Chamber of Deputies, and 2 by the Senate; members serve 9-year terms with partial membership replacement every 3 years (the court reviews constitutionality of legislation); Elections Qualifying Court members appointed by lottery - 1 by the former president or vice president of the Senate and 1 by the former president or vice president of the Chamber of Deputies, 2 by the Supreme Court, and 1 by the Appellate Court of Valparaiso; members appointed for 4-year terms
subordinate courts: Courts of Appeal; oral criminal tribunals; military tribunals; local police courts; specialized tribunals and courts in matters such as family, labor, customs, taxes, and electoral affairs
Political parties and leaders: This entry includes a listing of significant political parties, coalitions, and electoral lists as of each country's last legislative election, unless otherwise noted. Political parties and leaders field listing
Amplitude (Amplitud) [Lily PEREZ]
Broad Front Coalition (Frente Amplio) or FA (includes RD, PL, PH, PEV, Igualdad, and Poder) [Beatriz SANCHEZ]
Broad Social Movement of Leftist Citizens (includes former MAS and Izquierda Ciudadana) [Fernando ZAMORANO]
Christian Democratic Party or PDC [Fuad CHAHIN]
Citizen Power (Poder) [Karina OLIVA]
Communist Party of Chile or PC [Guillermo TEILLIER del Valle]
Democratic Revolution or RD [Rodrigo ECHECOPAR]
Equality Party (Igualdad) [Guillermo GONZALEZ]
Green Ecological Party or PEV [Felix GONZALEZ]
Humanist Party or PH [Octavio GONZALEZ]
Independent Democratic Union or UDI [Jacqueline VAN RYSSELBERGHE Herrera])
Independent Regionalist Democratic Party or PRI [Hugo ORTIZ de Filippi]
Let’s Go Chile Coalition (Chile Vamos) [Sebastian PINERA] (includes EVOPOLI, PRI, RN, UDI)
Liberal Party (Partido Liberal de Chile) or PL [Luis Felipe RAMOS]
National Renewal or RN [Mario DESBORDES]
New Majority Coalition (Nueva Mayoria) [Michelle BACHELET] (includes PDC, PC, PPD, PRSD, PS); note - dissolved in March 2018
Party for Democracy or PPD [Heraldo MUNOZ]
Political Evolution or EVOPOLI [Hernan LARRAIN MATTE]
Progressive Party or PRO [Camilo LAGOS]
Radical Social Democratic Party or PRSD [Carlos MALDONADO Curti],
Socialist Party or PS [Alvaro ELIZALDE Soto] (formerly known as Concertacion)
International organization participation: This entry lists in alphabetical order by abbreviation those international organizations in which the subject country is a member or participates in some other way. International organization participation field listing
APEC, BIS, CAN (associate), CD, CELAC, FAO, G-15, G-77, IADB, IAEA, IBRD, ICAO, ICC (national committees), ICCt, ICRM, IDA, IFAD, IFC, IFRCS, IHO, ILO, IMF, IMO, IMSO, Interpol, IOC, IOM, IPU, ISO, ITSO, ITU, ITUC (NGOs), LAES, LAIA, Mercosur (associate), MIGA, MINUSTAH, NAM, OAS, OECD (enhanced engagement), OPANAL, OPCW, Pacific Alliance, PCA, SICA (observer), UN, UNASUR, UNCTAD, UNESCO, UNFICYP, UNHCR, UNIDO, Union Latina, UNMOGIP, UNTSO, UNWTO, UPU, WCO, WFTU (NGOs), WHO, WIPO, WMO, WTO
Diplomatic representation in the US: This entry includes the chief of mission, chancery address, telephone, FAX, consulate general locations, and consulate locations. The use of the annotated title Appointed Ambassador refers to a new ambassador who has presented his/her credentials to the secretary of state but not the US president. Such ambassadors fulfill all diplomatic functions except meeting with or appearing at functions attended by the president until such time as they formally present their credentials at a White Hou . . . more Diplomatic representation in the US field listing
Ambassador Oscar Alfonso Sebastian SILVA Navarro (since 17 September 2018)
chancery: 1732 Massachusetts Avenue NW, Washington, DC 20036
telephone: [1] (202) 785-1746
FAX: [1] (202) 887-5579
consulate(s) general: Chicago, Houston, Los Angeles, Miami, New York, San Francisco
Diplomatic representation from the US: This entry includes the chief of mission, embassy address, mailing address, telephone number, FAX number, branch office locations, consulate general locations, and consulate locations. Diplomatic representation from the US field listing
chief of mission: Ambassador (vacant); Charge d'Affaires Baxter HUNT (since January 2019)
telephone: [56] (2) 2330-3000
embassy: Avenida Andres Bello 2800, Las Condes, Santiago
mailing address: APO AA 34033
FAX: [56] (2) 2330-3710, 2330-3160
Flag description: This entry provides a written flag description produced from actual flags or the best information available at the time the entry was written. The flags of independent states are used by their dependencies unless there is an officially recognized local flag. Some disputed and other areas do not have flags. Flag description field listing
two equal horizontal bands of white (top) and red; a blue square the same height as the white band at the hoist-side end of the white band; the square bears a white five-pointed star in the center representing a guide to progress and honor; blue symbolizes the sky, white is for the snow-covered Andes, and red represents the blood spilled to achieve independence
note: design influenced by the US flag
National symbol(s): A national symbol is a faunal, floral, or other abstract representation - or some distinctive object - that over time has come to be closely identified with a country or entity. Not all countries have national symbols; a few countries have more than one. National symbol(s) field listing
huemul (mountain deer), Andean condor; national colors: red, white, blue
National anthem: A generally patriotic musical composition - usually in the form of a song or hymn of praise - that evokes and eulogizes the history, traditions, or struggles of a nation or its people. National anthems can be officially recognized as a national song by a country's constitution or by an enacted law, or simply by tradition. Although most anthems contain lyrics, some do not. National anthem field listing
name: "Himno Nacional de Chile" (National Anthem of Chile)
lyrics/music: Eusebio LILLO Robles and Bernardo DE VERA y Pintado/Ramon CARNICER y Battle
note: music adopted 1828, original lyrics adopted 1818, adapted lyrics adopted 1847; under Augusto PINOCHET's military rule, a verse glorifying the army was added; however, as a protest, some citizens refused to sing this verse; it was removed when democracy was restored in 1990
Economy :: Chile
Economy - overview: This entry briefly describes the type of economy, including the degree of market orientation, the level of economic development, the most important natural resources, and the unique areas of specialization. It also characterizes major economic events and policy changes in the most recent 12 months and may include a statement about one or two key future macroeconomic trends. Economy - overview field listing
Chile has a market-oriented economy characterized by a high level of foreign trade and a reputation for strong financial institutions and sound policy that have given it the strongest sovereign bond rating in South America. Exports of goods and services account for approximately one-third of GDP, with commodities making up some 60% of total exports. Copper is Chile’s top export and provides 20% of government revenue.
From 2003 through 2013, real growth averaged almost 5% per year, despite a slight contraction in 2009 that resulted from the global financial crisis. Growth slowed to an estimated 1.4% in 2017. A continued drop in copper prices prompted Chile to experience its third consecutive year of slow growth.
Chile deepened its longstanding commitment to trade liberalization with the signing of a free trade agreement with the US, effective 1 January 2004. Chile has 26 trade agreements covering 60 countries including agreements with the EU, Mercosur, China, India, South Korea, and Mexico. In May 2010, Chile signed the OECD Convention, becoming the first South American country to join the OECD. In October 2015, Chile signed the Trans-Pacific Partnership trade agreement, which was finalized as the Comprehensive and Progressive Trans-Pacific Partnership (CPTPP) and signed at a ceremony in Chile in March 2018.
The Chilean Government has generally followed a countercyclical fiscal policy, under which it accumulates surpluses in sovereign wealth funds during periods of high copper prices and economic growth, and generally allows deficit spending only during periods of low copper prices and growth. As of 31 October 2016, those sovereign wealth funds - kept mostly outside the country and separate from Central Bank reserves - amounted to more than $23.5 billion. Chile used these funds to finance fiscal stimulus packages during the 2009 economic downturn.
In 2014, then-President Michelle BACHELET introduced tax reforms aimed at delivering her campaign promise to fight inequality and to provide access to education and health care. The reforms are expected to generate additional tax revenues equal to 3% of Chile’s GDP, mostly by increasing corporate tax rates to OECD averages.
GDP (purchasing power parity): This entry gives the gross domestic product (GDP) or value of all final goods and services produced within a nation in a given year. A nation's GDP at purchasing power parity (PPP) exchange rates is the sum value of all goods and services produced in the country valued at prices prevailing in the United States in the year noted. This is the measure most economists prefer when looking at per-capita welfare and when comparing living conditions or use of resources across countries. The measur . . . more GDP (purchasing power parity) field listing
$452.1 billion (2017 est.)
$445.5 billion (2016 est.)
$439.9 billion (2015 est.)
note: data are in 2017 dollars
country comparison to the world: 44
GDP (official exchange rate): This entry gives the gross domestic product (GDP) or value of all final goods and services produced within a nation in a given year. A nation's GDP at official exchange rates (OER) is the home-currency-denominated annual GDP figure divided by the bilateral average US exchange rate with that country in that year. The measure is simple to compute and gives a precise measure of the value of output. Many economists prefer this measure when gauging the economic power an economy maintains vis- . . . more GDP (official exchange rate) field listing
$277 billion (2017 est.)
GDP - real growth rate: This entry gives GDP growth on an annual basis adjusted for inflation and expressed as a percent. The growth rates are year-over-year, and not compounded. GDP - real growth rate field listing
1.5% (2017 est.)
1.3% (2016 est.)
2.3% (2015 est.)
country comparison to the world: 170
GDP - per capita (PPP): This entry shows GDP on a purchasing power parity basis divided by population as of 1 July for the same year. GDP - per capita (PPP) field listing
$24,600 (2017 est.)
$24,500 (2016 est.)
$24,400 (2015 est.)
note: data are in 2017 dollars
country comparison to the world: 82
Gross national saving: Gross national saving is derived by deducting final consumption expenditure (household plus government) from Gross national disposable income, and consists of personal saving, plus business saving (the sum of the capital consumption allowance and retained business profits), plus government saving (the excess of tax revenues over expenditures), but excludes foreign saving (the excess of imports of goods and services over exports). The figures are presented as a percent of GDP. A negative . . . more Gross national saving field listing
20.5% of GDP (2017 est.)
20.9% of GDP (2016 est.)
21.4% of GDP (2015 est.)
country comparison to the world: 94
GDP - composition, by end use: This entry shows who does the spending in an economy: consumers, businesses, government, and foreigners. The distribution gives the percentage contribution to total GDP of household consumption, government consumption, investment in fixed capital, investment in inventories, exports of goods and services, and imports of goods and services, and will total 100 percent of GDP if the data are complete. household consumption consists of expenditures by resident households, and by nonprofit insti . . . more GDP - composition, by end use field listing
household consumption: 62.3% (2017 est.)
government consumption: 14% (2017 est.)
investment in fixed capital: 21.5% (2017 est.)
investment in inventories: 0.5% (2017 est.)
exports of goods and services: 28.7% (2017 est.)
imports of goods and services: -27% (2017 est.)
GDP - composition, by sector of origin: This entry shows where production takes place in an economy. The distribution gives the percentage contribution of agriculture, industry, and services to total GDP, and will total 100 percent of GDP if the data are complete. Agriculture includes farming, fishing, and forestry. Industry includes mining, manufacturing, energy production, and construction. Services cover government activities, communications, transportation, finance, and all other private economic activities that do not prod . . . more GDP - composition, by sector of origin field listing
agriculture: 4.2% (2017 est.)
industry: 32.8% (2017 est.)
services: 63% (2017 est.)
Agriculture - products: This entry is an ordered listing of major crops and products starting with the most important. Agriculture - products field listing
grapes, apples, pears, onions, wheat, corn, oats, peaches, garlic, asparagus, beans; beef, poultry, wool; fish; timber
Industries: This entry provides a rank ordering of industries starting with the largest by value of annual output. Industries field listing
copper, lithium, other minerals, foodstuffs, fish processing, iron and steel, wood and wood products, transport equipment, cement, textiles
Industrial production growth rate: This entry gives the annual percentage increase in industrial production (includes manufacturing, mining, and construction). Industrial production growth rate field listing
-0.4% (2017 est.)
country comparison to the world: 170
Labor force: This entry contains the total labor force figure. Labor force field listing
8.881 million (2017 est.)
country comparison to the world: 58
Labor force - by occupation: This entry lists the percentage distribution of the labor force by sector of occupation. Agriculture includes farming, fishing, and forestry. Industry includes mining, manufacturing, energy production, and construction. Services cover government activities, communications, transportation, finance, and all other economic activities that do not produce material goods. The distribution will total less than 100 percent if the data are incomplete and may range from 99-101 percent due to rounding. more Labor force - by occupation field listing
agriculture: 9.2%
industry: 23.7%
services: 67.1% (2013)
Unemployment rate: This entry contains the percent of the labor force that is without jobs. Substantial underemployment might be noted. Unemployment rate field listing
6.7% (2017 est.)
6.5% (2016 est.)
country comparison to the world: 99
Population below poverty line: National estimates of the percentage of the population falling below the poverty line are based on surveys of sub-groups, with the results weighted by the number of people in each group. Definitions of poverty vary considerably among nations. For example, rich nations generally employ more generous standards of poverty than poor nations. Population below poverty line field listing
14.4% (2013)
Household income or consumption by percentage share: Data on household income or consumption come from household surveys, the results adjusted for household size. Nations use different standards and procedures in collecting and adjusting the data. Surveys based on income will normally show a more unequal distribution than surveys based on consumption. The quality of surveys is improving with time, yet caution is still necessary in making inter-country comparisons. Household income or consumption by percentage share field listing
lowest 10%: 1.7%
highest 10%: 41.5% (2013 est.)
Budget: This entry includes revenues, expenditures, and capital expenditures. These figures are calculated on an exchange rate basis, i.e., not in purchasing power parity (PPP) terms. Budget field listing
revenues: 57.75 billion (2017 est.)
expenditures: 65.38 billion (2017 est.)
Taxes and other revenues: This entry records total taxes and other revenues received by the national government during the time period indicated, expressed as a percent of GDP. Taxes include personal and corporate income taxes, value added taxes, excise taxes, and tariffs. Other revenues include social contributions - such as payments for social security and hospital insurance - grants, and net revenues from public enterprises. Normalizing the data, by dividing total revenues by GDP, enables easy comparisons acr . . . more Taxes and other revenues field listing
20.8% (of GDP) (2017 est.)
country comparison to the world: 145
Budget surplus (+) or deficit (-): This entry records the difference between national government revenues and expenditures, expressed as a percent of GDP. A positive (+) number indicates that revenues exceeded expenditures (a budget surplus), while a negative (-) number indicates the reverse (a budget deficit). Normalizing the data, by dividing the budget balance by GDP, enables easy comparisons across countries and indicates whether a national government saves or borrows money. Countries with high budget deficits (relat . . . more Budget surplus (+) or deficit (-) field listing
-2.8% (of GDP) (2017 est.)
country comparison to the world: 124
Public debt: This entry records the cumulative total of all government borrowings less repayments that are denominated in a country's home currency. Public debt should not be confused with external debt, which reflects the foreign currency liabilities of both the private and public sector and must be financed out of foreign exchange earnings. Public debt field listing
23.6% of GDP (2017 est.)
21% of GDP (2016 est.)
country comparison to the world: 182
Fiscal year: This entry identifies the beginning and ending months for a country's accounting period of 12 months, which often is the calendar year but which may begin in any month. All yearly references are for the calendar year (CY) unless indicated as a noncalendar fiscal year (FY). Fiscal year field listing
calendar year
Inflation rate (consumer prices): This entry furnishes the annual percent change in consumer prices compared with the previous year's consumer prices. Inflation rate (consumer prices) field listing
2.2% (2017 est.)
3.8% (2016 est.)
country comparison to the world: 113
Current account balance: This entry records a country's net trade in goods and services, plus net earnings from rents, interest, profits, and dividends, and net transfer payments (such as pension funds and worker remittances) to and from the rest of the world during the period specified. These figures are calculated on an exchange rate basis, i.e., not in purchasing power parity (PPP) terms. Current account balance field listing
-$4.102 billion (2017 est.)
-$3.484 billion (2016 est.)
country comparison to the world: 178
Exports: This entry provides the total US dollar amount of merchandise exports on an f.o.b. (free on board) basis. These figures are calculated on an exchange rate basis, i.e., not in purchasing power parity (PPP) terms. Exports field listing
$69.23 billion (2017 est.)
$60.6 billion (2016 est.)
country comparison to the world: 42
Exports - partners: This entry provides a rank ordering of trading partners starting with the most important; it sometimes includes the percent of total dollar value. Exports - partners field listing
China 27.5%, US 14.5%, Japan 9.3%, South Korea 6.2%, Brazil 5% (2017)
Exports - commodities: This entry provides a listing of the highest-valued exported products; it sometimes includes the percent of total dollar value. Exports - commodities field listing
copper, fruit, fish products, paper and pulp, chemicals, wine
Imports: This entry provides the total US dollar amount of merchandise imports on a c.i.f. (cost, insurance, and freight) or f.o.b. (free on board) basis. These figures are calculated on an exchange rate basis, i.e., not in purchasing power parity (PPP) terms. Imports field listing
$61.31 billion (2017 est.)
$55.29 billion (2016 est.)
country comparison to the world: 49
Imports - commodities: This entry provides a listing of the highest-valued imported products; it sometimes includes the percent of total dollar value. Imports - commodities field listing
petroleum and petroleum products, chemicals, electrical and telecommunications equipment, industrial machinery, vehicles, natural gas
Imports - partners: This entry provides a rank ordering of trading partners starting with the most important; it sometimes includes the percent of total dollar value. Imports - partners field listing
China 23.9%, US 18.1%, Brazil 8.6%, Argentina 4.5%, Germany 4% (2017)
Reserves of foreign exchange and gold: This entry gives the dollar value for the stock of all financial assets that are available to the central monetary authority for use in meeting a country's balance of payments needs as of the end-date of the period specified. This category includes not only foreign currency and gold, but also a country's holdings of Special Drawing Rights in the International Monetary Fund, and its reserve position in the Fund. Reserves of foreign exchange and gold field listing
$38.98 billion (31 December 2017 est.)
$40.49 billion (31 December 2016 est.)
country comparison to the world: 44
Debt - external: This entry gives the total public and private debt owed to nonresidents repayable in internationally accepted currencies, goods, or services. These figures are calculated on an exchange rate basis, i.e., not in purchasing power parity (PPP) terms. Debt - external field listing
$183.4 billion (31 December 2017 est.)
$158.1 billion (31 December 2016 est.)
country comparison to the world: 37
Exchange rates: This entry provides the average annual price of a country's monetary unit for the time period specified, expressed in units of local currency per US dollar, as determined by international market forces or by official fiat. The International Organization for Standardization (ISO) 4217 alphabetic currency code for the national medium of exchange is presented in parenthesis. Closing daily exchange rates are not presented in The World Factbook, but are used to convert stock values - e.g., the . . . more Exchange rates field listing
Chilean pesos (CLP) per US dollar -
653.9 (2017 est.)
676.94 (2016 est.)
676.94 (2015 est.)
658.93 (2014 est.)
570.37 (2013 est.)
Energy :: Chile
Electricity access: This entry provides information on access to electricity. Electrification data – collected from industry reports, national surveys, and international sources – consists of four subfields. Population without electricity provides an estimate of the number of citizens that do not have access to electricity. Electrification – total population is the percent of a country’s total population with access to electricity, electrification – urban areas is the percent of a country’s urban population w . . . more Electricity access field listing
electrification - total population: 100% (2016)
Electricity - production: This entry is the annual electricity generated expressed in kilowatt-hours. The discrepancy between the amount of electricity generated and/or imported and the amount consumed and/or exported is accounted for as loss in transmission and distribution. Electricity - production field listing
76.09 billion kWh (2016 est.)
country comparison to the world: 39
Electricity - consumption: This entry consists of total electricity generated annually plus imports and minus exports, expressed in kilowatt-hours. The discrepancy between the amount of electricity generated and/or imported and the amount consumed and/or exported is accounted for as loss in transmission and distribution. Electricity - consumption field listing
73.22 billion kWh (2016 est.)
country comparison to the world: 38
Electricity - exports: This entry is the total exported electricity in kilowatt-hours. Electricity - exports field listing
0 kWh (2016 est.)
country comparison to the world: 121
Electricity - imports: This entry is the total imported electricity in kilowatt-hours. Electricity - imports field listing
0 kWh (2016 est.)
country comparison to the world: 135
Electricity - installed generating capacity: This entry is the total capacity of currently installed generators, expressed in kilowatts (kW), to produce electricity. A 10-kilowatt (kW) generator will produce 10 kilowatt hours (kWh) of electricity, if it runs continuously for one hour. Electricity - installed generating capacity field listing
24.53 million kW (2016 est.)
country comparison to the world: 37
Electricity - from fossil fuels: This entry measures the capacity of plants that generate electricity by burning fossil fuels (such as coal, petroleum products, and natural gas), expressed as a share of the country's total generating capacity. Electricity - from fossil fuels field listing
59% of total installed capacity (2016 est.)
country comparison to the world: 133
Electricity - from nuclear fuels: This entry measures the capacity of plants that generate electricity through radioactive decay of nuclear fuel, expressed as a share of the country's total generating capacity. Electricity - from nuclear fuels field listing
0% of total installed capacity (2017 est.)
country comparison to the world: 66
Electricity - from hydroelectric plants: This entry measures the capacity of plants that generate electricity by water-driven turbines, expressed as a share of the country's total generating capacity. Electricity - from hydroelectric plants field listing
26% of total installed capacity (2017 est.)
country comparison to the world: 75
Electricity - from other renewable sources: This entry measures the capacity of plants that generate electricity by using renewable energy sources other than hydroelectric (including, for example, wind, waves, solar, and geothermal), expressed as a share of the country's total generating capacity. Electricity - from other renewable sources field listing
15% of total installed capacity (2017 est.)
country comparison to the world: 57
Crude oil - production: This entry is the total amount of crude oil produced, in barrels per day (bbl/day). Crude oil - production field listing
3,000 bbl/day (2018 est.)
country comparison to the world: 84
Crude oil - exports: This entry is the total amount of crude oil exported, in barrels per day (bbl/day). Crude oil - exports field listing
0 bbl/day (2017 est.)
country comparison to the world: 106
Crude oil - imports: This entry is the total amount of crude oil imported, in barrels per day (bbl/day). Crude oil - imports field listing
169,600 bbl/day (2017 est.)
country comparison to the world: 33
Crude oil - proved reserves: This entry is the stock of proved reserves of crude oil, in barrels (bbl). Proved reserves are those quantities of petroleum which, by analysis of geological and engineering data, can be estimated with a high degree of confidence to be commercially recoverable from a given date forward, from known reservoirs and under current economic conditions. Crude oil - proved reserves field listing
150 million bbl (1 January 2018 est.)
country comparison to the world: 60
Refined petroleum products - production: This entry is the country's total output of refined petroleum products, in barrels per day (bbl/day). The discrepancy between the amount of refined petroleum products produced and/or imported and the amount consumed and/or exported is due to the omission of stock changes, refinery gains, and other complicating factors. Refined petroleum products - production field listing
216,200 bbl/day (2017 est.)
country comparison to the world: 49
Refined petroleum products - consumption: This entry is the country's total consumption of refined petroleum products, in barrels per day (bbl/day). The discrepancy between the amount of refined petroleum products produced and/or imported and the amount consumed and/or exported is due to the omission of stock changes, refinery gains, and other complicating factors. Refined petroleum products - consumption field listing
354,500 bbl/day (2017 est.)
country comparison to the world: 39
Refined petroleum products - exports: This entry is the country's total exports of refined petroleum products, in barrels per day (bbl/day). Refined petroleum products - exports field listing
7,359 bbl/day (2017 est.)
country comparison to the world: 87
Refined petroleum products - imports: This entry is the country's total imports of refined petroleum products, in barrels per day (bbl/day). Refined petroleum products - imports field listing
166,400 bbl/day (2017 est.)
country comparison to the world: 38
Natural gas - production: This entry is the total natural gas produced in cubic meters (cu m). The discrepancy between the amount of natural gas produced and/or imported and the amount consumed and/or exported is due to the omission of stock changes and other complicating factors. Natural gas - production field listing
1.218 billion cu m (2017 est.)
country comparison to the world: 65
Natural gas - consumption: This entry is the total natural gas consumed in cubic meters (cu m). The discrepancy between the amount of natural gas produced and/or imported and the amount consumed and/or exported is due to the omission of stock changes and other complicating factors. Natural gas - consumption field listing
5.125 billion cu m (2017 est.)
country comparison to the world: 58
Natural gas - exports: This entry is the total natural gas exported in cubic meters (cu m). Natural gas - exports field listing
277.5 million cu m (2017 est.)
country comparison to the world: 43
Natural gas - imports: This entry is the total natural gas imported in cubic meters (cu m). Natural gas - imports field listing
4.446 billion cu m (2017 est.)
country comparison to the world: 38
Natural gas - proved reserves: This entry is the stock of proved reserves of natural gas in cubic meters (cu m). Proved reserves are those quantities of natural gas, which, by analysis of geological and engineering data, can be estimated with a high degree of confidence to be commercially recoverable from a given date forward, from known reservoirs and under current economic conditions. Natural gas - proved reserves field listing
97.97 billion cu m (1 January 2018 est.)
country comparison to the world: 52
Carbon dioxide emissions from consumption of energy: This entry is the total amount of carbon dioxide, measured in metric tons, released by burning fossil fuels in the process of producing and consuming energy. Carbon dioxide emissions from consumption of energy field listing
88.23 million Mt (2017 est.)
country comparison to the world: 47
Communications :: Chile
Telephones - fixed lines: This entry gives the total number of fixed telephone lines in use, as well as the number of subscriptions per 100 inhabitants. Telephones - fixed lines field listing
total subscriptions: 2,997,192
subscriptions per 100 inhabitants: 17 (2018 est.)
country comparison to the world: 47
Telephones - mobile cellular: This entry gives the total number of mobile cellular telephone subscribers, as well as the number of subscriptions per 100 inhabitants. Note that because of the ubiquity of mobile phone use in developed countries, the number of subscriptions per 100 inhabitants can exceed 100. Telephones - mobile cellular field listing
total subscriptions: 25,178,981
subscriptions per 100 inhabitants: 140 (2018 est.)
country comparison to the world: 49
Telecommunication systems: This entry includes a brief general assessment of the telecommunications system with details on the domestic and international components. The following terms and abbreviations are used throughout the entry: Arabsat - Arab Satellite Communications Organization (Riyadh, Saudi Arabia). Autodin - Automatic Digital Network (US Department of Defense). CB - citizen's band mobile radio communications. Cellular telephone system - the telephones in this system are radio transceivers, with each inst . . . more Telecommunication systems field listing
general assessment: most advanced telecommunications infrastructure in South America; although Chile has one of the highest mobile penetration rates in the region, the number of subscribers has fallen due to subscribers ending multiple SIM card use; the country ranks second highest in South and Central America in terms of available broadband speeds; effective competition in the broadband and mobile sectors; LTE infrastructure is extensive but National Plan for 5G services awaits spectrum auctions; during the COVID-19 pandemic Chile provided free access to educational content for about 3 million school pupils (2020)
domestic: number of fixed-line connections have stagnated to 17 per 100 in recent years as mobile-cellular usage continues to increase, reaching 140 telephones per 100 persons; domestic satellite system with 3 earth stations (2018)
international: country code - 56; landing points for the Pan-Am, Prat, SAm-1, American Movil-Telxius West Coast Cable, FOS Quellon-Chacabuco, Fibra Optical Austral, SAC and Curie submarine cables providing links to the US, Caribbean and to Central and South America; satellite earth stations - 2 Intelsat (Atlantic Ocean) (2019)
note: the COVID-19 outbreak is negatively impacting telecommunications production and supply chains globally; consumer spending on telecom devices and services has also slowed due to the pandemic's effect on economies worldwide; overall progress towards improvements in all facets of the telecom industry - mobile, fixed-line, broadband, submarine cable and satellite - has moderated
Broadcast media: This entry provides information on the approximate number of public and private TV and radio stations in a country, as well as basic information on the availability of satellite and cable TV services. Broadcast media field listing
national and local terrestrial TV channels, coupled with extensive cable TV networks; the state-owned Television Nacional de Chile (TVN) network is self-financed through commercial advertising revenues and is not under direct government control; large number of privately owned TV stations; about 250 radio stations
Internet country code: This entry includes the two-letter codes maintained by the International Organization for Standardization (ISO) in the ISO 3166 Alpha-2 list and used by the Internet Assigned Numbers Authority (IANA) to establish country-coded top-level domains (ccTLDs). Internet country code field listing
.cl
Internet users: This entry gives the total number of individuals within a country who can access the Internet at home, via any device type (computer or mobile) and connection. The percent of population with Internet access (i.e., the penetration rate) helps gauge how widespread Internet use is within a country. Statistics vary from country to country and may include users who access the Internet at least several times a week to those who access it only once within a period of several months. Internet users field listing
total: 11,650,840
percent of population: 66% (July 2016 est.)
country comparison to the world: 46
Broadband - fixed subscriptions: This entry gives the total number of fixed-broadband subscriptions, as well as the number of subscriptions per 100 inhabitants. Fixed broadband is a physical wired connection to the Internet (e.g., coaxial cable, optical fiber) at speeds equal to or greater than 256 kilobits/second (256 kbit/s). Broadband - fixed subscriptions field listing
total: 3,250,678
subscriptions per 100 inhabitants: 18 (2018 est.)
country comparison to the world: 39
Military and Security :: Chile
Military expenditures: This entry gives spending on defense programs for the most recent year available as a percent of gross domestic product (GDP); the GDP is calculated on an exchange rate basis, i.e., not in terms of purchasing power parity (PPP). For countries with no military forces, this figure can include expenditures on public security and police. Military expenditures field listing
1.8% of GDP (2019)
1.9% of GDP (2018)
1.9% of GDP (2017)
1.9% of GDP (2016)
1.9% of GDP (2015)
country comparison to the world: 59
Military and security forces: This entry lists the military and security forces subordinate to defense ministries or the equivalent (typically ground, naval, air, and marine forces), as well as those belonging to interior ministries or the equivalent (typically gendarmeries, border/coast guards, paramilitary police, and other internal security forces). Military and security forces field listing
Armed Forces of Chile (Fuerzas Armadas de Chile): Chilean Army, Chilean Navy (Armada de Chile, includes Naval Aviation, Marine Corps, and Maritime Territory and Merchant Marine Directorate (Directemar)), Chilean Air Force (Fuerza Aerea de Chile, FACh); Carabineros de Chile (National Police Force) (2019)
note: Carabineros de Chile are responsible to both the Ministry of Defense and the Ministry of Interior
Military service age and obligation: This entry gives the required ages for voluntary or conscript military service and the length of service obligation. Military service age and obligation field listing
18-45 years of age for voluntary male and female military service, although the right to compulsory recruitment of males 18-45 is retained; service obligation is 12 months for Army and 22 months for Navy and Air Force (2015)
Transportation :: Chile
National air transport system: This entry includes four subfields describing the air transport system of a given country in terms of both structure and performance. The first subfield, number of registered air carriers, indicates the total number of air carriers registered with the country’s national aviation authority and issued an air operator certificate as required by the Convention on International Civil Aviation. The second subfield, inventory of registered aircraft operated by air carriers, lists the total number . . . more National air transport system field listing
number of registered air carriers: 9 (2015)
inventory of registered aircraft operated by air carriers: 173 (2015)
annual passenger traffic on registered air carriers: 15,006,762 (2015)
annual freight traffic on registered air carriers: 1,392,236,000 mt-km (2015)
Civil aircraft registration country code prefix: This entry provides the one- or two-character alphanumeric code indicating the nationality of civil aircraft. Article 20 of the Convention on International Civil Aviation (Chicago Convention), signed in 1944, requires that all aircraft engaged in international air navigation bear appropriate nationality marks. The aircraft registration number consists of two parts: a prefix consisting of a one- or two-character alphanumeric code indicating nationality and a registration suffix of one to fi . . . more Civil aircraft registration country code prefix field listing
CC (2016)
Airports: This entry gives the total number of airports or airfields recognizable from the air. The runway(s) may be paved (concrete or asphalt surfaces) or unpaved (grass, earth, sand, or gravel surfaces) and may include closed or abandoned installations. Airports or airfields that are no longer recognizable (overgrown, no facilities, etc.) are not included. Note that not all airports have accommodations for refueling, maintenance, or air traffic control. Airports field listing
481 (2013)
country comparison to the world: 14
Airports - with paved runways: This entry gives the total number of airports with paved runways (concrete or asphalt surfaces) by length. For airports with more than one runway, only the longest runway is included according to the following five groups - (1) over 3,047 m (over 10,000 ft), (2) 2,438 to 3,047 m (8,000 to 10,000 ft), (3) 1,524 to 2,437 m (5,000 to 8,000 ft), (4) 914 to 1,523 m (3,000 to 5,000 ft), and (5) under 914 m (under 3,000 ft). Only airports with usable runways are included in this listing. Not all . . . more Airports - with paved runways field listing
total: 90 (2017)
over 3,047 m: 5 (2017)
2,438 to 3,047 m: 7 (2017)
1,524 to 2,437 m: 23 (2017)
914 to 1,523 m: 31 (2017)
under 914 m: 24 (2017)
Airports - with unpaved runways: This entry gives the total number of airports with unpaved runways (grass, dirt, sand, or gravel surfaces) by length. For airports with more than one runway, only the longest runway is included according to the following five groups - (1) over 3,047 m (over 10,000 ft), (2) 2,438 to 3,047 m (8,000 to 10,000 ft), (3) 1,524 to 2,437 m (5,000 to 8,000 ft), (4) 914 to 1,523 m (3,000 to 5,000 ft), and (5) under 914 m (under 3,000 ft). Only airports with usable runways are included in this listin . . . more Airports - with unpaved runways field listing
total: 391 (2013)
2,438 to 3,047 m: 5 (2013)
1,524 to 2,437 m: 11 (2013)
914 to 1,523 m: 56 (2013)
under 914 m: 319 (2013)
Heliports: This entry gives the total number of heliports with hard-surface runways, helipads, or landing areas that support routine sustained helicopter operations exclusively and have support facilities including one or more of the following facilities: lighting, fuel, passenger handling, or maintenance. It includes former airports used exclusively for helicopter operations but excludes heliports limited to day operations and natural clearings that could support helicopter landings and takeoffs. Heliports field listing
1 (2013)
Pipelines: This entry gives the lengths and types of pipelines for transporting products like natural gas, crude oil, or petroleum products. Pipelines field listing
3160 km gas, 781 km liquid petroleum gas, 985 km oil, 722 km refined products (2013)
Railways: This entry states the total route length of the railway network and of its component parts by gauge, which is the measure of the distance between the inner sides of the load-bearing rails. The four typical types of gauges are: broad, standard, narrow, and dual. Other gauges are listed under note. Some 60% of the world's railways use the standard gauge of 1.4 m (4.7 ft). Gauges vary by country and sometimes within countries. The choice of gauge during initial construction was mainly in resp . . . more Railways field listing
total: 7,282 km (2014)
narrow gauge: 3,853.5 km 1.000-m gauge (2014)
broad gauge: 3,428 km 1.676-m gauge (1,691 km electrified) (2014)
country comparison to the world: 30
Roadways: This entry gives the total length of the road network and includes the length of the paved and unpaved portions. Roadways field listing
total: 77,801 km (2016)
country comparison to the world: 62
Merchant marine: This entry provides the total and the number of each type of privately or publicly owned commercial ship for each country; military ships are not included; the five ships by type include: bulk carrier - for cargo such as coal, grain, cement, ores, and gravel; container ship - for loads in truck-size containers, a transportation system called containerization; general cargo - also referred to as break-bulk containers - for a wide variety of packaged merchandise, such as textiles, furniture . . . more Merchant marine field listing
total: 221
by type: bulk carrier 7, container ship 5, general cargo 51, oil tanker 14, other 144 (2019)
country comparison to the world: 63
Ports and terminals: This entry lists major ports and terminals primarily on the basis of the amount of cargo tonnage shipped through the facilities on an annual basis. In some instances, the number of containers handled or ship visits were also considered. Most ports service multiple classes of vessels including bulk carriers (dry and liquid), break bulk cargoes (goods loaded individually in bags, boxes, crates, or drums; sometimes palletized), containers, roll-on/roll-off, and passenger ships. The listing le . . . more Ports and terminals field listing
major seaport(s): Coronel, Huasco, Lirquen, Puerto Ventanas, San Antonio, San Vicente, Valparaiso
container port(s) (TEUs): San Antonio (1,296,890), Valparaiso (1,073,734) (2017)
LNG terminal(s) (import): Mejillones, Quintero
Transnational Issues :: Chile
Disputes - international: This entry includes a wide variety of situations that range from traditional bilateral boundary disputes to unilateral claims of one sort or another. Information regarding disputes over international terrestrial and maritime boundaries has been reviewed by the US Department of State. References to other situations involving borders or frontiers may also be included, such as resource disputes, geopolitical questions, or irredentist issues; however, inclusion does not necessarily constitute . . . more Disputes - international field listing
Chile and Peru rebuff Bolivia's reactivated claim to restore the Atacama corridor, ceded to Chile in 1884, but Chile has offered instead unrestricted but not sovereign maritime access through Chile to Bolivian natural gas; Chile rejects Peru's unilateral legislation to change its latitudinal maritime boundary with Chile to an equidistance line with a southwestern axis favoring Peru; in October 2007, Peru took its maritime complaint with Chile to the ICJ; territorial claim in Antarctica (Chilean Antarctic Territory) partially overlaps Argentine and British claims; the joint boundary commission, established by Chile and Argentina in 2001, has yet to map and demarcate the delimited boundary in the inhospitable Andean Southern Ice Field (Campo de Hielo Sur)
Refugees and internally displaced persons: This entry includes those persons residing in a country as refugees, internally displaced persons (IDPs), or stateless persons. Each country's refugee entry includes only countries of origin that are the source of refugee populations of 5,000 or more. The definition of a refugee according to a UN Convention is "a person who is outside his/her country of nationality or habitual residence; has a well-founded fear of persecution because of his/her race, religion, nationality, membership in a . . . more Refugees and internally displaced persons field listing
refugees (country of origin): 476,238 (Venezuela) (economic and political crisis; includes Venezuelans who have claimed asylum or have received alternative legal stay) (2019)
Illicit drugs: This entry gives information on the five categories of illicit drugs - narcotics, stimulants, depressants (sedatives), hallucinogens, and cannabis. These categories include many drugs legally produced and prescribed by doctors as well as those illegally produced and sold outside of medical channels. Cannabis (Cannabis sativa) is the common hemp plant, which provides hallucinogens with some sedative properties, and includes marijuana (pot, Acapulco gold, grass, reefer), tetrahydroca . . . more Illicit drugs field listing
transshipment country for cocaine destined for Europe and the region; some money laundering activity, especially through the Iquique Free Trade Zone; imported precursors passed on to Bolivia; domestic cocaine consumption is rising, making Chile a significant consumer of cocaine
